• Photonics Research
  • Vol. 10, Issue 11, 2513 (2022)
Jiading Tian1、2, Zehui Wang3, Qirong Xiao1、2、*, Dan Li1、2, Ping Yan1、2, and Mali Gong1、2
Author Affiliations
  • 1Department of Precision Instrument, Ministry of Education Key Laboratory of Photonic Control Technology, Tsinghua University, Beijing 100084, China
  • 2Department of Precision Instrument, State Key Laboratory of Precision Measurement Technology and Instruments, Tsinghua University, Beijing 100084, China
  • 3Department of Laser Equipment, Jiangsu Shuguang Photoelectric Co., Ltd., Yangzhou 225009, China
  • show less
    DOI: 10.1364/PRJ.465896 Cite this Article Set citation alerts
    Jiading Tian, Zehui Wang, Qirong Xiao, Dan Li, Ping Yan, Mali Gong. On the initiation of fiber fuse damage in high-power ytterbium-doped fiber lasers[J]. Photonics Research, 2022, 10(11): 2513 Copy Citation Text show less
    Continuous frames (30 frames per second) of a camera video of the PFF. The cylinder on which the fiber is coiled has a diameter of ∼50 cm.
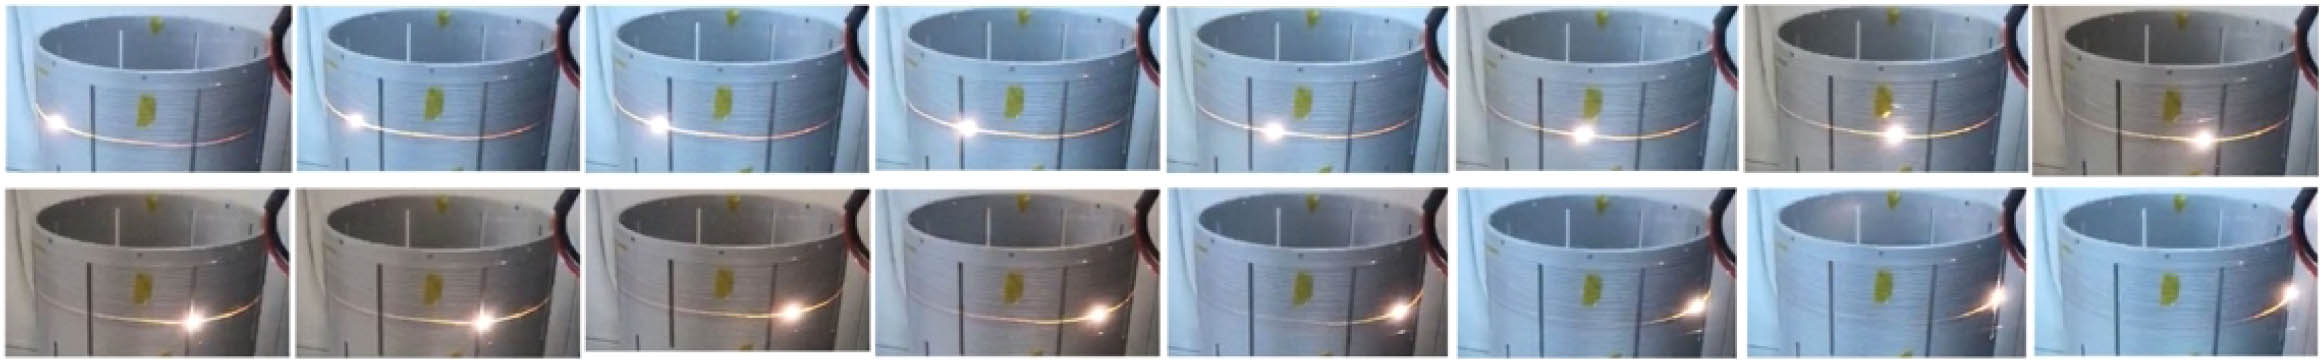
    Fig. 1. Continuous frames (30 frames per second) of a camera video of the PFF. The cylinder on which the fiber is coiled has a diameter of 50  cm.
    Experimental setup for measuring the critical conditions for IFF.
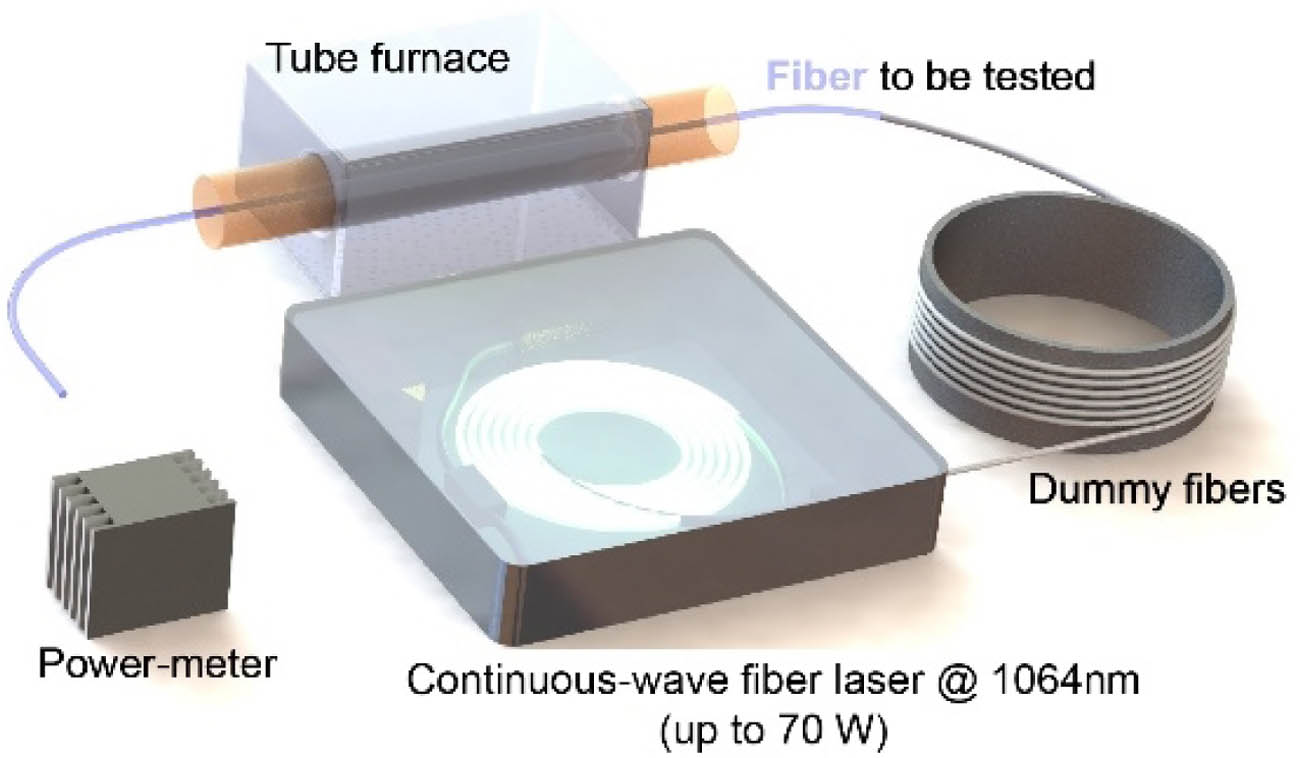
    Fig. 2. Experimental setup for measuring the critical conditions for IFF.
    Experimental data of the critical conditions for IFF. (a) Critical temperatures Tc and critical optical powers Pc for IFF; (b) linear correlation between 1/Tc and ln Pc.
    Fig. 3. Experimental data of the critical conditions for IFF. (a) Critical temperatures Tc and critical optical powers Pc for IFF; (b) linear correlation between 1/Tc and lnPc.
    Model of simulation using the 3D solid-state heat transfer with virtual-defect-induced-absorption heat source.
    Fig. 4. Model of simulation using the 3D solid-state heat transfer with virtual-defect-induced-absorption heat source.
    Simulation results of the critical conditions, using uF=u0, in comparison with the experimental results in Fig. 3; note that the horizontal axis here no longer remains of the same scale as in Fig. 3. (a) Simulation results using uF=u0 only obviously deviate from the experimental results. (b) Simulation results in coordination transformation, as in Fig. 3(b).
    Fig. 5. Simulation results of the critical conditions, using uF=u0, in comparison with the experimental results in Fig. 3; note that the horizontal axis here no longer remains of the same scale as in Fig. 3. (a) Simulation results using uF=u0 only obviously deviate from the experimental results. (b) Simulation results in coordination transformation, as in Fig. 3(b).
    Principles of determining the true value of uF (showing YDF1 as an example); all the curves of simulation results in this figure are schematic with no specific values. Subplots on the left show that initially by using uF=u0, the simulation results will always deviate from the experimental results. Subplots in the middle show that by increasing uF, the curves of simulation results will obtain larger slopes; the simulation results will attain a closer pattern of variation to that of the experimental results. Subplots on the right show that when true value of uF is met, it will allow a match between the experimental results and some simulation results at true α0. Till this, the true value of uF (as well as α0) is determined.
    Fig. 6. Principles of determining the true value of uF (showing YDF1 as an example); all the curves of simulation results in this figure are schematic with no specific values. Subplots on the left show that initially by using uF=u0, the simulation results will always deviate from the experimental results. Subplots in the middle show that by increasing uF, the curves of simulation results will obtain larger slopes; the simulation results will attain a closer pattern of variation to that of the experimental results. Subplots on the right show that when true value of uF is met, it will allow a match between the experimental results and some simulation results at true α0. Till this, the true value of uF (as well as α0) is determined.
    Simulation results that determine the true values of uF and α0 by best matching the experimental results of the critical conditions for IFF. (a) Simulation results compared with data in Fig. 3(a); (b) that compared with Fig. 3(b).
    Fig. 7. Simulation results that determine the true values of uF and α0 by best matching the experimental results of the critical conditions for IFF. (a) Simulation results compared with data in Fig. 3(a); (b) that compared with Fig. 3(b).
    Typical structure of the transverse structure around a fiber embedded in cooling setup (left) and its approximation for a cylindrically symmetrical model (right).
    Fig. 8. Typical structure of the transverse structure around a fiber embedded in cooling setup (left) and its approximation for a cylindrically symmetrical model (right).
    Simulation results of the damage thresholds of continuous-wave 976-nm pumped YDFA (a)–(c) and 1018-nm pumped YDFA (d)–(f) in typical configurations. (a), (d) Distribution of optical power (v.s. left vertical axis, pump power in blue dashed line, signal power in red dashed line), and the heat power density Q˙1 (v.s. right vertical axis, each line represents a setup of a different output power) along a presumed YDF. (b), (e) Distribution of temperature of the inner surface of coating layer T(r2) along the YDF; yellow zone labels typical ignition points of the polymer coating layer. (c), (f) Manifold showing the correlation between the in-core temperatures T(0) and the in-core total optical powers (solid lines); the critical conditions for IFF of the 4 kinds of 10/130-μm YDFs are also shown (dashed lines) for comparison.
    Fig. 9. Simulation results of the damage thresholds of continuous-wave 976-nm pumped YDFA (a)–(c) and 1018-nm pumped YDFA (d)–(f) in typical configurations. (a), (d) Distribution of optical power (v.s. left vertical axis, pump power in blue dashed line, signal power in red dashed line), and the heat power density Q˙1 (v.s. right vertical axis, each line represents a setup of a different output power) along a presumed YDF. (b), (e) Distribution of temperature of the inner surface of coating layer T(r2) along the YDF; yellow zone labels typical ignition points of the polymer coating layer. (c), (f) Manifold showing the correlation between the in-core temperatures T(0) and the in-core total optical powers (solid lines); the critical conditions for IFF of the 4 kinds of 10/130-μm YDFs are also shown (dashed lines) for comparison.
    Jiading Tian, Zehui Wang, Qirong Xiao, Dan Li, Ping Yan, Mali Gong. On the initiation of fiber fuse damage in high-power ytterbium-doped fiber lasers[J]. Photonics Research, 2022, 10(11): 2513
    Download Citation