
Yun Ye, Xianfeng Lin, Xiaoming Xi, Chen Shi, Baolai Yang, Hanwei Zhang, Xiaolin Wang, Jinyan Li, Xiaojun Xu. Novel constant-cladding tapered-core ytterbium-doped fiber for high-power fiber laser oscillator[J]. High Power Laser Science and Engineering, 2021, 9(2): 02000e21
- High Power Laser Science and Engineering
- Vol. 9, Issue 2, 02000e21 (2021)
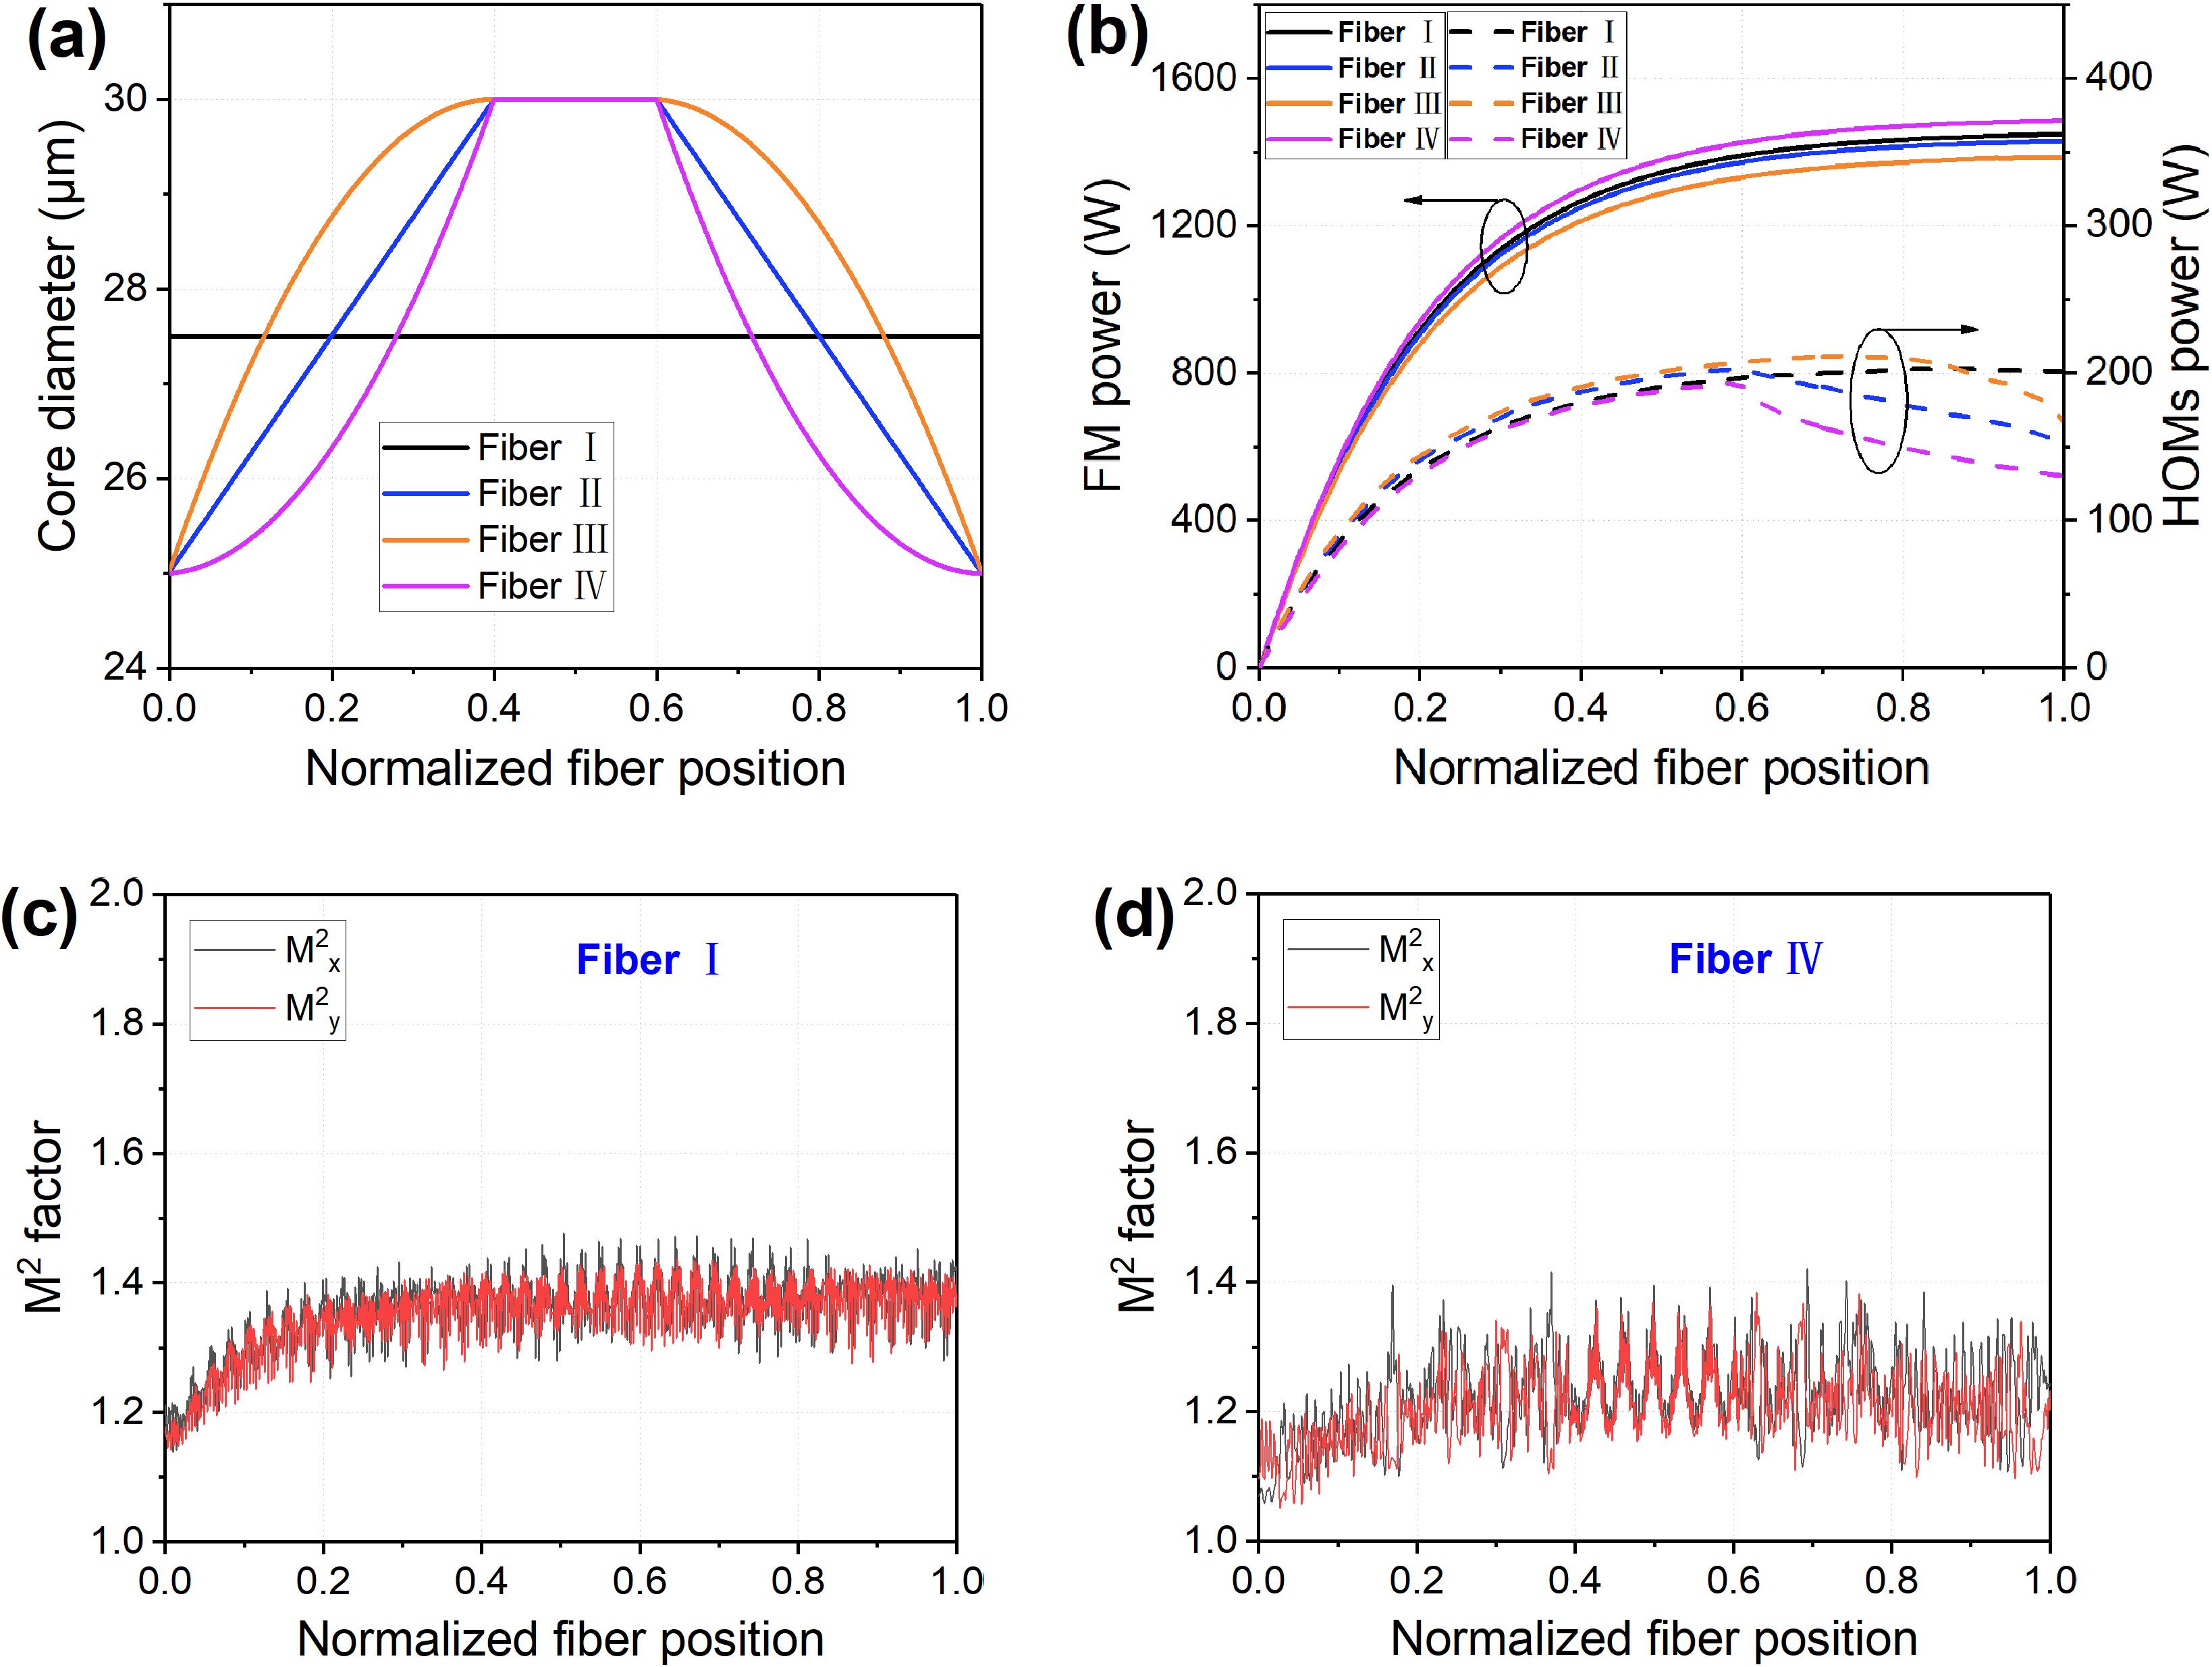
Fig. 1. Simulation results of four types of fiber: (a) the core dimeter distribution, (b) FM power and HOM power (solid line, FM power distribution in fiber; dotted line, HOMs power distribution in fiber), (c) M 2 factor evolution of Fiber I and (d) M 2 factor evolution of Fiber IV.
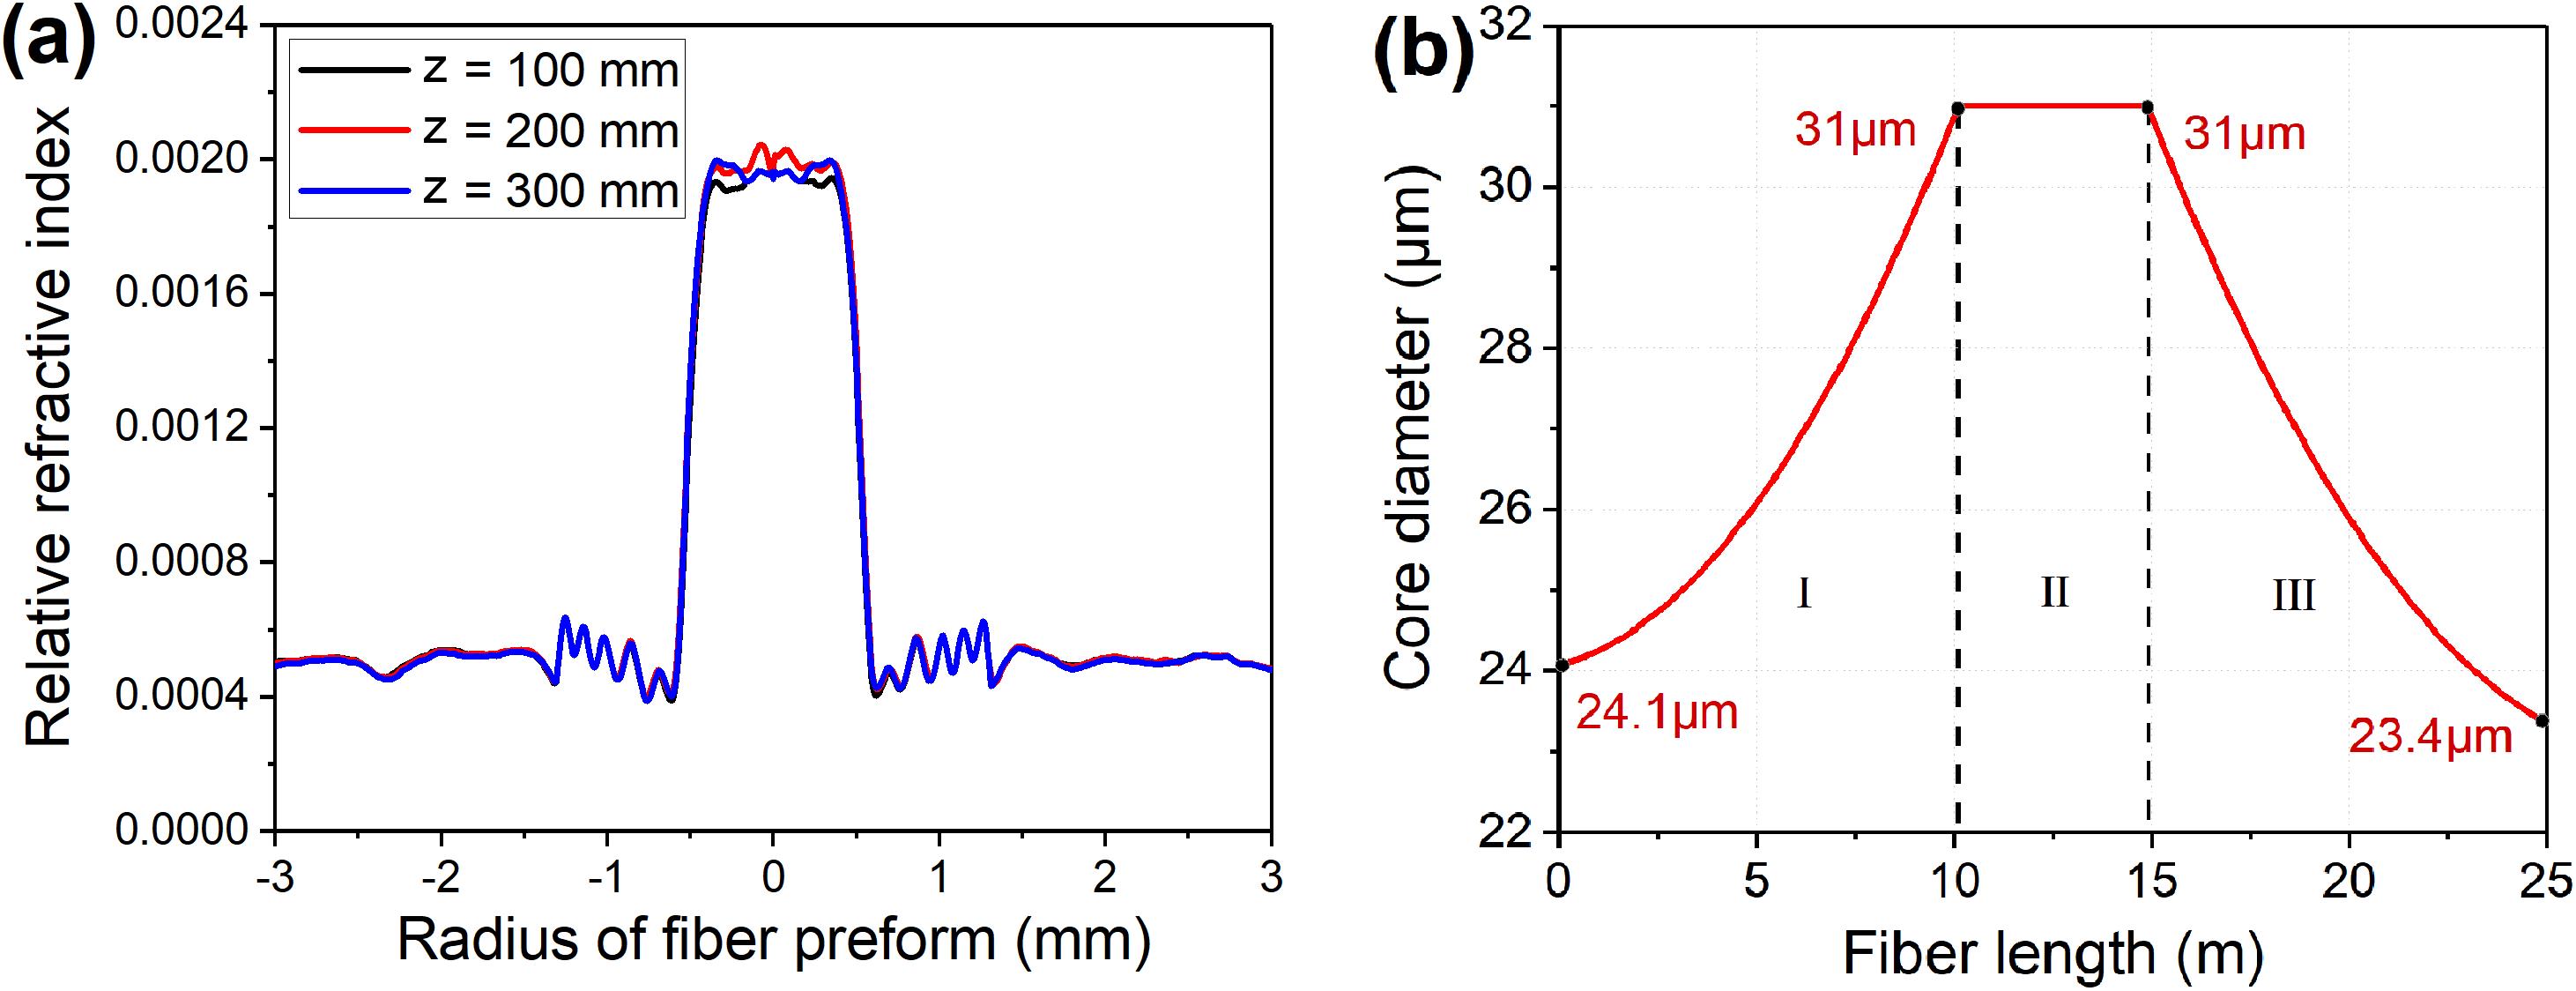
Fig. 2. (a) Refractive index profile at different positions along the length of the preform and (b) the core diameter distribution of the fabricated CCTC fiber.
Fig. 3. Schematic diagram of the post-processed preparation.
Fig. 4. Experimental setup of an all-fiber laser oscillator system. BQA, beam quality analyzer (Beam Squared, Ophir); CO, collimator; DM, dichroic mirror; HR, high reflection; OSA, optical spectrum analyzer (Yokogawa, 600–1700 nm); PD, photodetector (Thorlabs, 150 MHz, 700–1800 nm); PM, power meter.
Fig. 5. (a) Output power and corresponding optical-to-optical efficiency of the laser. The blue and green regions represent the backward and forward pump schemes, respectively. (b) Output spectrum measured at different output powers, showing an SRS suppression ratio of >35 dB at the maximum power.
Fig. 6. (a) The normalized temporal signal at different output powers, (b) its corresponding Fourier transform spectra and (c) the STD of the temporal signals at different output powers.
Fig. 7. (a) Measured beam quality evolution during the power scaling and (b) M 2 factor and beam profile at 3022 W.

Set citation alerts for the article
Please enter your email address
© Copyright 2018-2021 | Chinese Laser Press. All Rights Reserved 沪ICP备15018463号-20