1State Key Laboratory of High Field Laser Physics, Shanghai Institute of Optics and Fine Mechanics, Chinese Academy of Sciences, Shanghai 201800, China
2Center of Materials Science and Optoelectronics Engineering, University of Chinese Academy of Sciences, Beijing 100049, China
3Technology Center, Huagong Laser Engineering Co., Ltd., Wuhan 430000, China
One-step precipitation of Ag nanoparticles in Ag+-doped silicate glasses was achieved through a focused picosecond laser with a high repetition rate. Absorption spectra and transmission electron microscopy (TEM) confirmed that metallic Ag nanoparticles were precipitated within glass samples in the laser-written domain. The surface plasmon absorbance fits well with the experimental absorption spectrum. The nonlinear absorption coefficient β is determined to be 2.47 × 10⁻¹⁴ m/W by fitting the open aperture Z-scan curve, which originated from the intraband transition in the Ag band. The formation mechanism of Ag-glass nanocomposites is discussed as well.
When interacting with intense incident electromagnetic fields, nonlinear optical materials may produce output fields that differ in frequency, amplitude, or phase from the input field[1]. The applications of optical materials with large nonlinear optical coefficients can be found in saturable absorbers[2], optical limiters[3], wavelength converters[4], optical switching[5], second-harmonic imaging[6], electro-optic modulation[7], two-photon imaging[8], etc. The relevant nonlinear optical materials now include organic materials[9], chalcogenide glasses[10], two-dimensional inorganic semiconductor materials[11], quantum-dots-doped[12] or noble metal-nanoparticle-doped composite glass[13], etc.
Inorganic materials usually have better thermal stability and anti-aging ability compared to organic materials, which have been widely used in industry, military, aerospace, automotive, and civilian facilities. Among inorganic materials, glasses are more easily synthesized and mechanically machined than crystals. Also, composite glass has greater optical nonlinearities than pure glasses, for example, metal-nanoparticles-doped glasses have a quicker response, and is a million times that of fused silica[14] due to the higher free-electron density[15]. Metal nanoparticles can enhance the optical nonlinearity of glasses by quantum confinement and local electric field effect near the plasmon resonance frequency. Overall, the third-order nonlinear optical materials requirements include low linear and nonlinear absorption, simple synthesis, thermal stability, convenient mechanical treatment, rapid response, and high nonlinear susceptibility[16]. Metal-nanoparticles-doped glasses are promising for fulfilling all of these requirements.
Nonlinear inorganic glasses doped with metal nanoparticles can be prepared conventionally by ion implantation, heat treatment, magnetron sputtering, and sol-gel methods[17–20]. Laser treatment has recently attracted a lot of attention since laser provides three-dimensional (3D) spatially selective precipitation of metal nanoparticles in bulk glasses. Previous work focused mainly on fabricating metal nanoparticles in the glass by femtosecond lasers. Successive annealing is typically expected after low-repetition-rate femtosecond laser writing[21,22], which is time-consuming. Metal Ag nanoparticles were directly introduced without successive heat treatment by using a high-repetition-rate femtosecond laser[23–25]. However, femtosecond laser writing resulted in micro-voids in the glass matrix[23]. Therefore, the transmittance of the glasses was reduced due to the interface reflection in these defects.
Sign up for Chinese Optics Letters TOC. Get the latest issue of Chinese Optics Letters delivered right to you!Sign up now
In this Letter, we use a high-repetition-rate picosecond laser to directly precipitate Ag nanoparticles in silicate glass, which could reduce the reflection loss caused by structural defects. Also, the solubility of in silicate glass is usually limited because the maximum concentration in previous studies[22–25] is only 0.1% (mole fraction). By adding in the prepared glass samples, the concentration will increase to six times greater than that of previous studies[22–25].
2. Experiment
-doped silicate glasses were prepared by the conventional melt-quenching technique. The composition of starting raw materials is , where stands for the nominal amount of added in mole fraction. All of the reagents are analytical grade. In the glass system, , , and acted as refining agents. The reagents were thoroughly mixed and filled into crucibles. Each batch was melted for 3 h under an ambient atmosphere in a resistively heated furnace at 1600°C. The melts were poured onto a preheated copper plate (at 400°C) and splash-cooled by pressing with another copper plate. The solidified samples were subsequently annealed at 570°C for 4 h. Thus, we obtained glass samples with a composition of (mole fraction). Depending on the concentration of , glass samples are labeled as S1 to S6, as shown in Table 1.
Sample
S1
S2
S3
S4
S5
S6
Concentration of Ag (%)
0
0.01
0.04
0.16
0.64
2.56
Table 1. Concentrations of Doped- in the Silicate Glasses
For the precipitation of Ag nanoparticles inside silicate glasses, a high-repetition-rate picosecond laser (HE1060, Fianium) was used. The laser was operated at a pulse duration of 100 ps, a wavelength of 532 nm, and a repetition rate of 500 kHz. A microscope (Nikon Eclipse ME600) with a 50 times objective lens at a numerical aperture of 0.8 was used to focus the laser beam into the bulk of the sample. Glass samples were translated at a precision of 1 µm using an XYZ stage (Prior Stage II). A CCD camera (Mshot MC50) equipped on a microscope was used for real-time monitoring.
A UV-visible (VIS)-near-IR (NIR) spectrophotometer (Jasco V570) with a resolution of 0.3 nm was used to record the absorbance of glass samples in the wavelength range of 200–800 nm. Transmission electron microscopy (TEM) measurement was done by a field emission transmission electron microscope (Tecnai G2 F20 S-TWIN, FEI). The glass transition temperature was measured by a differential scanning calorimeter (Netzsch Sta 409). The Z-scan technique was introduced to measure the optical nonlinearity of glass samples. The femtosecond laser source in the Z-scan measurement was a Ti-sapphire laser (Spectra-Physics, Spitfire), with a repetition rate of 1 kHz, a wavelength of 800 nm, and the pulse width is 185 fs. A silicon detector (Coherent OP-2 VIS) and a thermal detector (Coherent PM3) separately record the incident and transmitted laser power.
3. Results and Discussion
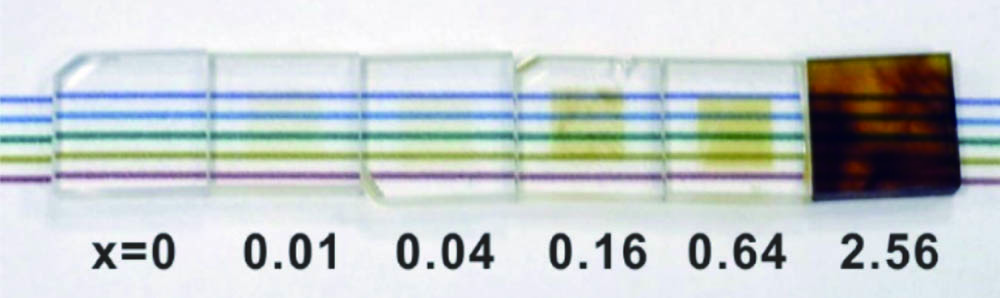
In Fig. 1, we show the fabricated -doped silicate glass samples and the resulting samples subjected to laser treatment. Samples S1–S5 are colorless, while S6 with higher value possesses a dull brown coloration, implying Ag precipitation[22]. Samples S1–S5 are all irradiated by the picosecond laser with the same parameters with a rectangular region (, μ). It can be found that the laser-irradiated region in S1 remains colorless, while the laser-treated zone in S2–S5 turns yellow, indicating the precipitation of Ag nanoparticles[22]. It is quite obvious that the laser-induced color of yellow becomes darker, but is still transparent with increasing concentrations, which indicates a higher concentration of Ag nanoparticles.
Figure 1.Photographs of -doped silicate glasses with a rectangular region processed by a picosecond laser at an average power of 1.1 W and a scanning speed of 200 µm/s.
Therefore, we can infer that by adding , at least 0.64% of silver ions will dissolve in this form of silicate glass, and this dissolving concentration is six times greater than that of previous studies (0.1%)[22–25]. However, there is not any theoretical explanation that we can refer to so far. We assume that Ag can hardly break the Si-O-Si bond, thus restricting the dissolving concentration. However, the glass network former possesses a triangle structure, so the Sb-O-Sb bond can be broken more easily by Ag atoms, as shown in Fig. 2[26]. In this way, more could be dissolved in the glass matrix.
Figure 2.Ag atoms dissolve in the glass network by breaking the Sb-O-Sb bond.
Absorption spectra before and after irradiation by picosecond laser pulses are illustrated in Fig. 3. For precursor glass, the absorption spectra of S1–S4 are almost overlapped due to the low concentration of Ag [Fig. 3(a)]. After laser irradiation, the absorption intensity of all of the samples is significantly enhanced, as shown in Fig. 3(b).
Figure 3.Absorption spectra of five glass samples (a) before and (b) after picosecond laser irradiation; (c) difference absorbance after picosecond laser irradiation.
An obvious absorbance peak of sample S5 appears, whereas no absorbance peak is ever found for S1, S2, S3, and S4. From the difference spectra of the glass samples before and after laser irradiation, we can see a more distinct absorption peak around 430 nm, which is a typical absorption band of Ag nanoparticles[23].
Theoretical absorbance of silicate glass with Ag nanoparticles precipitated in it is also determined in addition to the measured absorbance of precipitated Ag nanoparticles. Based on the Maxwell–Garnett theory, the absorbance coefficient is calculated using Eq. (1):where the effective dielectric constant of Ag nanoparticles contained in silicate glass is expressed as and , where plasmon frequency is , free-electron damping constant is , and dielectric constants of metal and surrounding glass matrix are 4.2 and 2.34, respectively[27]. The volume ratio η of Ag nanoparticles could be calculated by , where , , and represent the mass, volume, and density of Ag, while , , and are the mass, volume, and density of the final glass sample. As the dissolving concentration of Ag in the glass sample is quite low, we assume that the volume ratio of Ag nanoparticles is equal to the volume ratio of Ag ions. Therefore, in S5 is about 0.27%.
In this model, absorbance is proportional to with an unknown factor. By selecting an appropriate multiplier, theoretical absorbance is fitted in Fig. 4(a). Comparing the theoretical and measured absorbance in Fig. 4(a), the position and shape of the surface plasmon resonance (SPR) can be seen to fit well with the experimental absorption of silicate glass with Ag nanoparticles. The experimental absorbance peak is around 416 nm, and the resonant wavelength of Ag nanoparticles is at 424 nm. However, the full width at half-maximum of the experimental absorption is wider than the calculated value. This difference can be attributed to the size dispersion of Ag nanoparticles and the change of absorption of the microstructures.
Figure 4.(a) Experimental difference spectrum and theoretical fitting curve of Ag nanoparticle SPR of S5; (b) TEM image of Ag nanoparticles precipitated in the laser-irradiated zone of S5.
TEM observes Ag nanoparticles in silicate glasses. Ag aggregates into crystal nuclei and grows into nanoparticles due to the heat accumulation of picosecond laser pulses. As seen in Fig. 4(b), the diameter of Ag nanoparticle ranges from 9 nm to 19 nm, and the average diameter is about 14 nm.
The peak power density of the picosecond laser is a key factor for the precipitation of Ag nanoparticles in silicate glass. The picosecond laser could not induce microstructures until the average power is increased to 0.86 W. The diffraction-limited spot size of the laser () can be estimated as , where is the beam quality factor, which is about 1.5 in this experiment, is the wavelength of the laser beam, is the focal length of the objective lens with the value of 4 mm, D is the beam diameter, and its value is 2.5 mm. Therefore, the laser beam is focused on a spot size of about μ in diameter. Thus, the critical peak power density for precipitating Ag nanoparticles is about .
In addition to peak power density, laser scanning speed also plays an important role in the precipitation of Ag nanoparticles. Figure 5 shows the optical micrographs of the laser-induced seven lines in S5 with the laser scanning speed range of 16, 32, 64,…, 1024 µm/s at an average power of 1.1 W. Micro-voids are observed when scanning speed is 16 and 32 µm/s, which is caused by the high pressure induced by multiple picosecond laser pulses. When the scanning speed ranges from 64 to 512 µm/s, Ag nanoparticles are precipitated homogeneously in the glass matrix. However, with the laser moving faster than 1024 µm/s, laser-induced heat is not sufficiently high, so only a small portion of Ag aggregates into nanoparticles. Thus, the color is relatively light. So, for TEM and absorption measurement, a scanning speed of 200 µm/s was chosen. The inset photograph of Fig. 5 shows an obvious color contrast of the laser fabricated region in S5 at speeds of 200 and 1000 µm/s.
Figure 5.Optical micrographs of scanned lines by picosecond laser pulses at different processing speeds of 16, 32, 64,…, 1024 µm/s. The inset shows the color comparison of the laser fabricated region in S5 at speeds of 200 and 1000 µm/s.
A previous study shows that in top-view microscope images of the femtosecond laser-irradiated region, it appears as a ring. Ag aggregated in the center of the ring-shaped region, namely in the micro-void. The femtosecond laser transforms the material in the focal point into plasma and generates a fast-outward propagating shockwave, which leaves micro-voids in silicate glass. The micro-void was mainly caused by the electrical repulsive force between a mass of electrons, and the micro-void interface reflection will reduce the transmittance of glass. The different absorption peaks of the glass sample before and after femtosecond laser treatment are therefore as high as about 0.22[23]. However, the picosecond laser has a longer pulse duration, thus pulse energy can be transferred to a lattice[28] and absorbed to melt glass before plasma comes into being, which avoids the formation of micro-voids. So, we observed a much lower absorption peak of about 0.036 in Fig. 4(a). Compared with a femtosecond laser, picosecond laser fabrication can greatly decrease the linear absorption of -doped glass. Ag nanoparticles precipitation in silicate glass by picosecond lasers is, therefore, more suitable for real applications.
After Ag nanoparticles were precipitated in S5, its nonlinear optical property was measured using the Z-scan experimental technique. The normalized transmittance is described in Eq. (2)[29]:where , , and . Rayleigh distance is 2.95 mm. Sample thickness L is 0.8 mm. The linear absorption coefficient of irradiated glass S5 is . From the experimental waist radius, is 31.4 µm, and the pulse duration of femtosecond laser τ is 131 fs. P and R represent the incident power and repetition rate of a femtosecond laser, respectively.
According to Eq. (2), at the laser focus (), the normalized transmittance has a linear relation with peak intensity, and the slope is , as shown in Eq. (3):where is the valley transmittance of the Z-scan plot.
Figure 6 (a) shows the normalized Z-scan transmittance of S5 at , and the Z-scan valley transmittance at different is also recorded in Fig. 6(b). According to Eq. (3), the nonlinear absorption coefficient of irradiated glass S5 is calculated to be . The nonlinear optical absorption is proposed to the intraband transition in the band of Ag instead of hot electrons and interband transition[30]. The hot electron effect can be neglected because the wavelength of the femtosecond laser is far from SPR. Interband transition does not happen, as the energy of two photons of the femtosecond laser is smaller than the narrowest interband gap (3.45 eV) of Ag[31].
Figure 6.(a) Normalized Z-scan transmittance of S5 at I0; (b) the dependence of Z-scan valley transmittance on incident laser intensity I0.
Space selective precipitation of Ag nanoparticles in silicate glass was achieved by 500 kHz picosecond laser pulses without further heat treatment. By adding , Ag concentration has been improved by six times in silicate glass. Linear absorbance was reduced to 0.0364 by preventing the formation of micro-voids. Nonlinear absorption coefficient is determined to be by fitting the open aperture Z-scan curve, which originates from an intraband transition in the band of Ag.