• Laser & Optoelectronics Progress
  • Vol. 56, Issue 5, 051101 (2019)
Hongyun Ye1, Heigang Xiong2、*, Fang Zhang1, Ning Wang1, and Lifang Ma1
Author Affiliations
  • 1 College of Resources and Environment Sciences, Xinjiang University/Key Laboratory of Oasis Ecology of Ministry of Education, Urumqi, Xinjiang 830046, China
  • 2 Urban Department of College of Applied Arts and Science, Beijing Union University, Beijing 100083, China
  • show less
    DOI: 10.3788/LOP56.051101 Cite this Article Set citation alerts
    Hongyun Ye, Heigang Xiong, Fang Zhang, Ning Wang, Lifang Ma. CWT-Based Estimation of Soil Organic Matter Content in Arid Area Under Different Human Disturbance Degrees[J]. Laser & Optoelectronics Progress, 2019, 56(5): 051101 Copy Citation Text show less
    Soil spectral curves under different human disturbance degrees
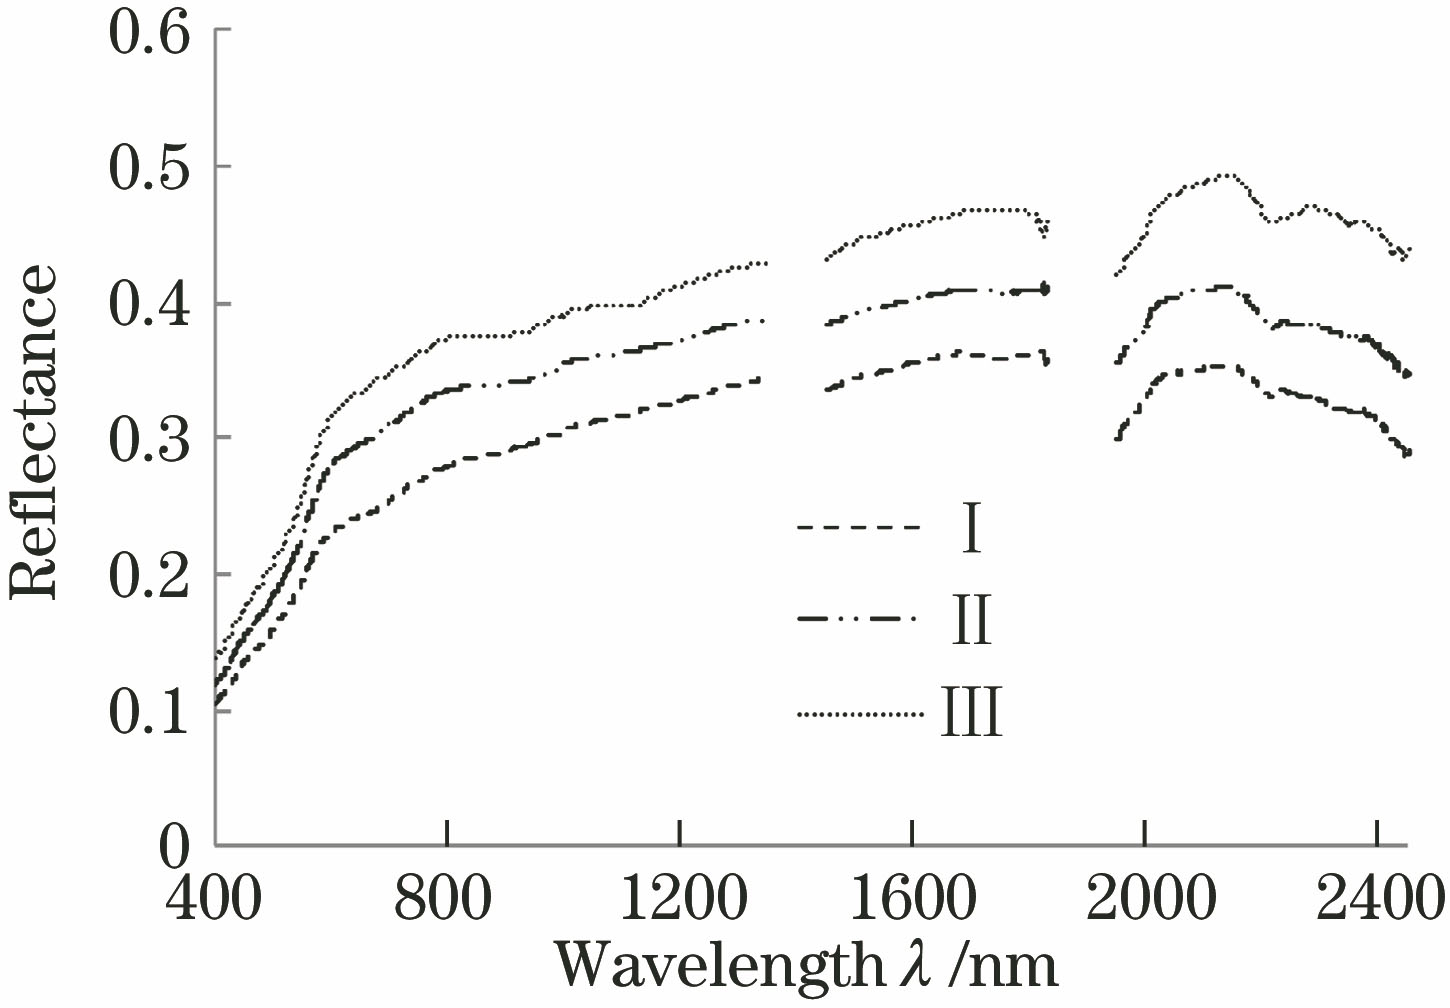
    Fig. 1. Soil spectral curves under different human disturbance degrees
    Correlation analysis among soil organic matter content, spectral reflectance, and its transformation. (a) Zone Ⅰ; (b) zone Ⅱ; (c) zone Ⅲ
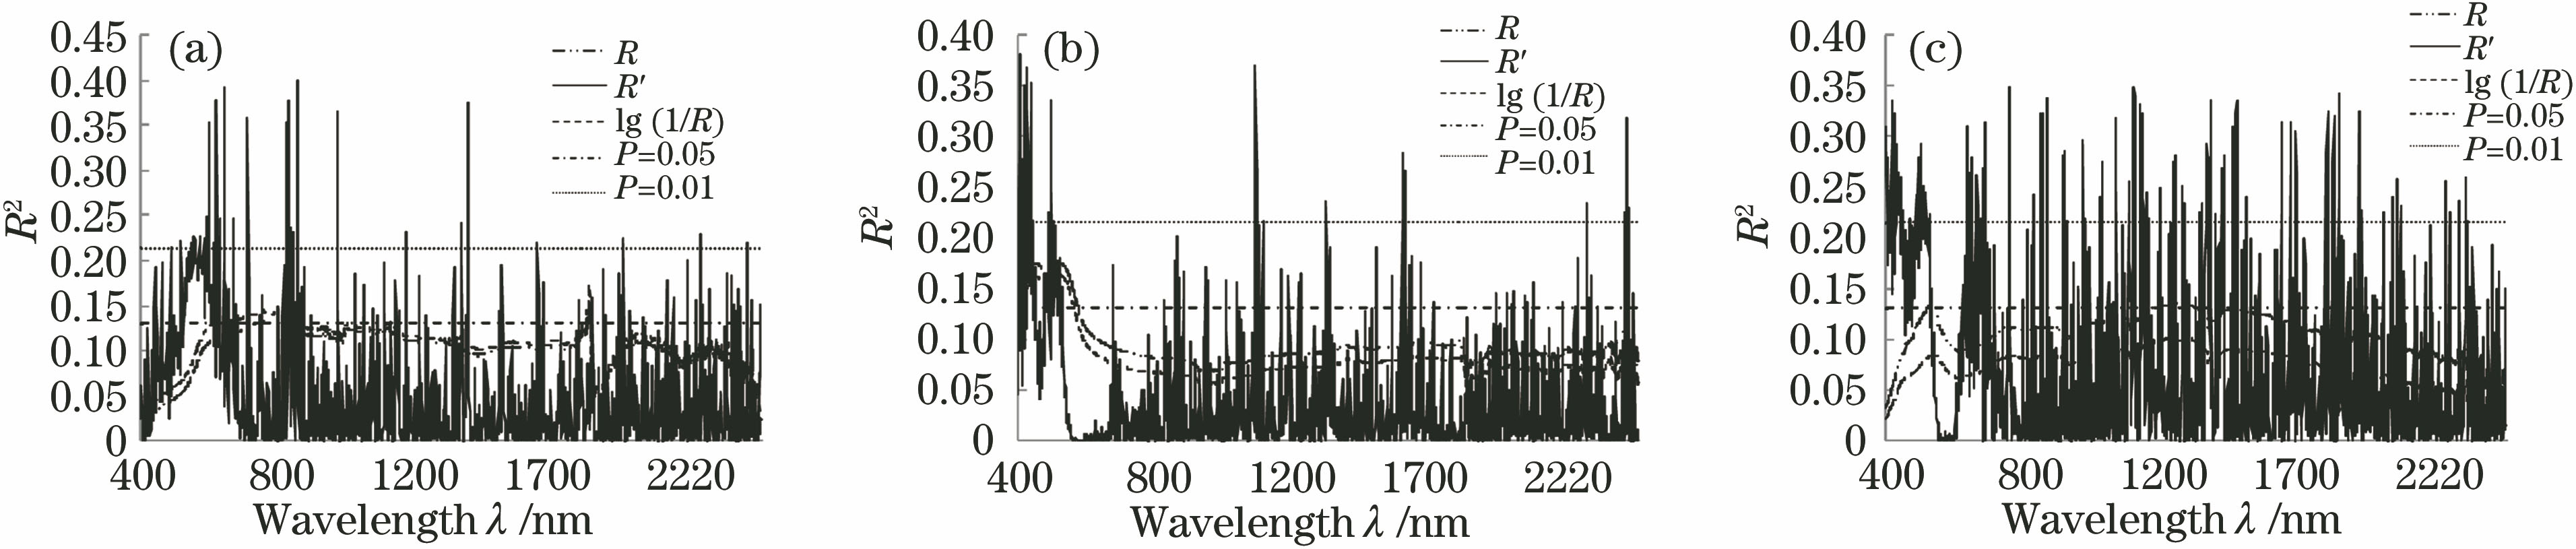
    Fig. 2. Correlation analysis among soil organic matter content, spectral reflectance, and its transformation. (a) Zone Ⅰ; (b) zone Ⅱ; (c) zone Ⅲ
    Correlation scalogram between R wavelet coefficient and soil organic matter content in mild disturbance zone
    Fig. 3. Correlation scalogram between R wavelet coefficient and soil organic matter content in mild disturbance zone
    Correlation scalogram between R wavelet coefficient and soil organic matter in moderate disturbance zone
    Fig. 4. Correlation scalogram between R wavelet coefficient and soil organic matter in moderate disturbance zone
    Correlation scalogram between R wavelet coefficient and soil organic matter content in severe disturbance zone
    Fig. 5. Correlation scalogram between R wavelet coefficient and soil organic matter content in severe disturbance zone
    Scatter plots of predicted and measured values of soil organic matter. (a) Zone Ⅰ; (b) zone Ⅱ; (c) zone Ⅲ
    Fig. 6. Scatter plots of predicted and measured values of soil organic matter. (a) Zone Ⅰ; (b) zone Ⅱ; (c) zone Ⅲ
    Kriging interpolation plots of measured and predicted values of soil organic matter content. (a) Zone Ⅰ; (b) zone Ⅱ; (c) zone Ⅲ
    Fig. 7. Kriging interpolation plots of measured and predicted values of soil organic matter content. (a) Zone Ⅰ; (b) zone Ⅱ; (c) zone Ⅲ
    TypeDisturbance intensionVegetation typeSoil typeVegetation coverage /%
    MildNative vegetationSierozem soil≥30
    ModerateNative vegetation、cash cropsSierozem soil15-30
    SevereCash crops、man-made forestSierozem soil≤15
    Table 1. Basic status of three typical disturbance zones in study area
    TypeSamplesetNumber ofsamplesMinimumvalue /(g·kg-1)Maximumvalue /(g·kg-1)Meanvalue /(g·kg-1)Standarddeviation /(g·kg-1)CV
    Whole set306.50714.70710.2572.0040.195
    Calibration set187.95214.1710.3441.7530.169
    Validation set126.50714.70710.1272.4090.238
    Whole set306.18215.2218.9392.2840.255
    Calibration set186.78614.7978.6581.8840.218
    Validation set126.18215.2219.362.8180.301
    Whole set303.61913.1077.9772.2970.288
    Calibration set183.61912.1337.4831.9350.259
    Validation set124.69513.1078.7172.670.306
    Table 2. Descriptive statistics of soil organic matter content
    TypeSpectral transformationSensitive bands /nm
    R746,762,805,1818,1824
    R619,645,715,1467,2270
    lg(1/R)699,762,781,800,1824
    R436,450,508,522,545
    R407,426,1100,1634,2417
    lg(1/R)434,453,500,523,534
    R536,1192,1254,1300,1555
    R418,860,1156,1822,2329
    lg(1/R)536,1192,1244,1256,1300
    Table 3. Selection of sensitive wavelengths
    TypeModelCalibration setValidation set
    R2RRMSER2RRMSERRPD
    R0.3721.3500.3352.3911.183
    R0.6950.9080.6281.5891.873
    lg(1/R)0.4411.2730.4861.7181.352
    CWT0.7520.8480.7171.1322.150
    R0.2741.5610.2892.3960.872
    R0.6681.1020.6161.8121.671
    lg(1/R)0.3681.3360.4212.3501.207
    CWT0.7060.9140.6891.7092.090
    R0.2451.4740.2142.4910.944
    R0.6241.0400.5822.0741.548
    lg(1/R)0.2891.3970.2703.4430.609
    CWT0.6521.1350.6301.9852.013
    Table 4. Calibration and validation results of inversion model for soil organic matter content
    Hongyun Ye, Heigang Xiong, Fang Zhang, Ning Wang, Lifang Ma. CWT-Based Estimation of Soil Organic Matter Content in Arid Area Under Different Human Disturbance Degrees[J]. Laser & Optoelectronics Progress, 2019, 56(5): 051101
    Download Citation