
Hao Zhang, Yaqing Hou, Xuandong Wang, Hang Su. In-Situ Alloying of 304L Stainless Steel by Laser Powder Bed Fusion[J]. Chinese Journal of Lasers, 2023, 50(4): 0402001
- Chinese Journal of Lasers
- Vol. 50, Issue 4, 0402001 (2023)
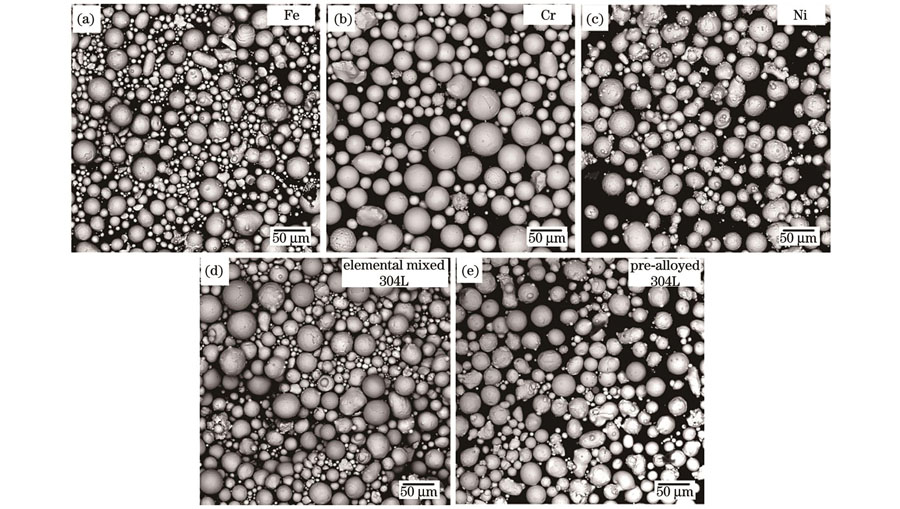
Fig. 1. SEM morphologies of powders. (a) Fe powder; (b) Cr powder; (c) Ni powder; (d) elemental mixed powder; (e) 304L pre-alloyed powder
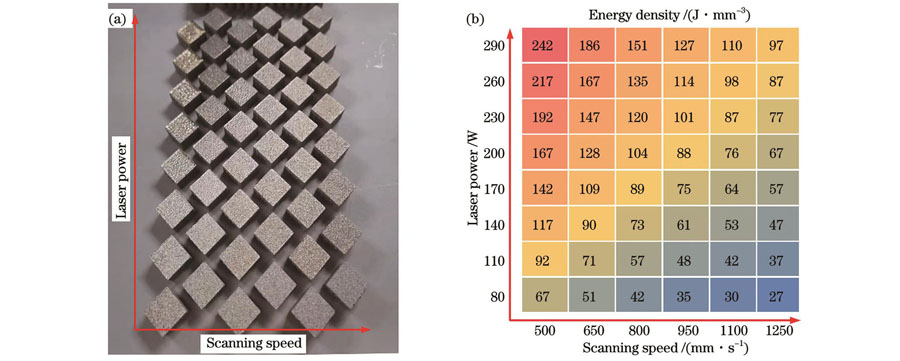
Fig. 2. Macro appearance of samples and laser energy density value. (a) Macro appearance of 304L in-situ alloyed samples prepared by LPBF using elemental mixed powder; (b) laser energy density value
Fig. 3. LPBF process window, where dotted lines represent laser energy density
Fig. 4. OM morphologies of 304L in-situ alloyed samples and pre-alloyed powder LPBF sample. (a) Sample A1; (b) sample S3; (c) sample S6; (d) sample A1
Fig. 5. Melt pool SEM morphologies of 304L in-situ alloyed samples and pre-alloyed powder LPBF sample. (a) Sample A1; (b) sample S3; (c) sample S6; (d) sample A1
Fig. 6. EDS analysis of 304L in-situ alloyed samples. (a) S3 sample; (b) S6 sample
Fig. 7. EDS analysis of 304L in-situ alloyed sample. (a) Mass fraction of Fe; (b) mass fraction of Cr; (c) mass fraction of Ni; (d) mass fraction deviation
Fig. 8. EBSD grain orientation and phase distribution of 304L in-situ alloyed LPBF samples and pre-alloyed powder LPBF sample. (a)-(c) Grain orientation maps of S3, S6, and A1 samples; (d)-(f) phase distribution maps of S3, S6, and A1 samples; (g)-(i) histograms of grain size distribution of S3, S6, and A1 samples
Fig. 9. Thermodynamic phase diagrams of 304L austenitic stainless steel. (a) Temperature changing phase diagram; (b) 1200 ℃ isothermal phase diagram with Cr content increasing
Fig. 10. Microhardness of 304L in-situ alloyed samples and pre-alloyed powder LPBF sample
|
Table 1. Powder particle size distribution
| |||||||||||||||||||||||||||||||||||||||
Table 2. Chemical composition of 304L pre-alloyed powder and elemental mixed powder
|
Table 3. Sample number, process parameters, and relative density

Set citation alerts for the article
Please enter your email address
© Copyright 2018-2021 | Chinese Laser Press. All Rights Reserved 沪ICP备15018463号-20