• Journal of Infrared and Millimeter Waves
  • Vol. 41, Issue 2, 470 (2022)
Yong-Heng BI1, Juan HUO1、*, Da-Ren LYU1, Tao SU2, Xue-Rong WANG2, and Bo LIU1
Author Affiliations
  • 1Key Laboratory of Middle Atmosphere and Global Environment Observation,Institute of Atmospheric Physics,China Academy of Sciences,Beijing 100029,China
  • 2Sun Create Electronics Co.,Ltd.,Hefei 230088,China
  • show less
    DOI: 10.11972/j.issn.1001-9014.2022.02.014 Cite this Article
    Yong-Heng BI, Juan HUO, Da-Ren LYU, Tao SU, Xue-Rong WANG, Bo LIU. Ka&W dual-frequency millimeter-wave cloud radar at Yangbajing ---Performance and comparison[J]. Journal of Infrared and Millimeter Waves, 2022, 41(2): 470 Copy Citation Text show less
    The appearance and block diagram of dual-frequency millimeter cloud radar
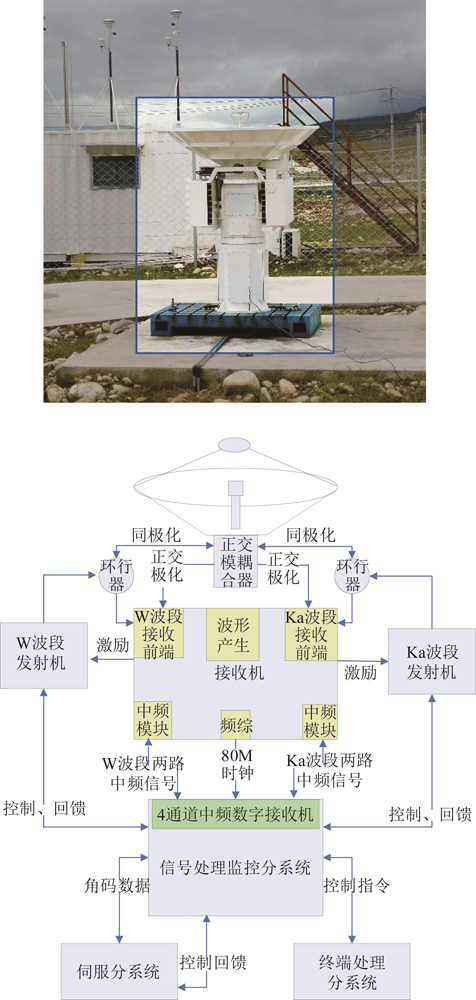
    Fig. 1. The appearance and block diagram of dual-frequency millimeter cloud radar
    Histogram of reflectivity and curve of sensitivity(a)Ka-band radar,(b)W-band radar("Number" indicates the number of measurements under the conditions of the corresponding height and reflectivity factor)
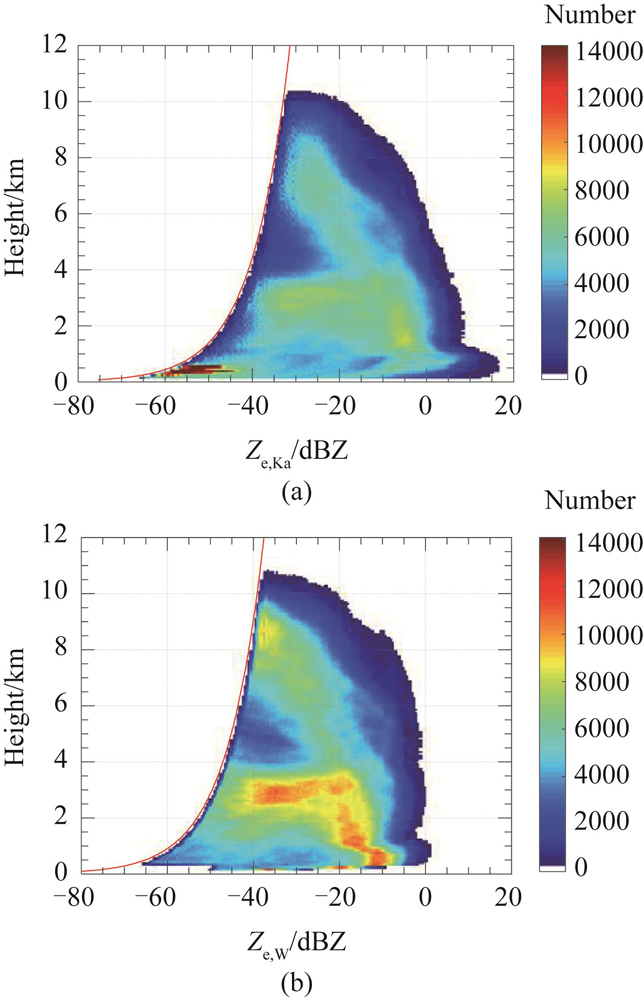
    Fig. 2. Histogram of reflectivity and curve of sensitivity(a)Ka-band radar,(b)W-band radar("Number" indicates the number of measurements under the conditions of the corresponding height and reflectivity factor)
    The altostratus cloud on March 3,2020(a)Ka-band radar Ze,Ka,(b)W-band radar Ze,W,(c)Dze
    Fig. 3. The altostratus cloud on March 3,2020(a)Ka-band radar Ze,Ka,(b)W-band radar Ze,W,(c)Dze
    The altostratus cloud March 3, 2020(a)Scatter histograms of reflectivity of Ka-band and W-band,(b)Dze histogram distribution
    Fig. 4. The altostratus cloud March 3, 2020(a)Scatter histograms of reflectivity of Ka-band and W-band,(b)Dze histogram distribution
    The altostratus cloud on March 3,2020(a)Ka-band Radar VKa,(b)W-band Radar VW,(c)the VDiff
    Fig. 5. The altostratus cloud on March 3,2020(a)Ka-band Radar VKa,(b)W-band Radar VW,(c)the VDiff
    March 3, 2020(a)Scatter histograms of V of Ka-band and W-band,(b)VDiff histogram distribution
    Fig. 6. March 3, 2020(a)Scatter histograms of V of Ka-band and W-band,(b)VDiff histogram distribution
    The case on August 23-24,2019(a)Ka-band radar Ze,Ka,(b)W-band radar Ze,W,(c)Dze
    Fig. 7. The case on August 23-24,2019(a)Ka-band radar Ze,Ka,(b)W-band radar Ze,W,(c)Dze
    The case on August 23-24, 2019(a)Dze histogram distribution,(b)The histogram distribution of Ze,W while the echo signal is not detected by Ka-band radar
    Fig. 8. The case on August 23-24, 2019(a)Dze histogram distribution,(b)The histogram distribution of Ze,W while the echo signal is not detected by Ka-band radar
    The precipitation cloud on August 7,2019(a)Ka-band radar Ze,Ka,(b)W-band radar Ze,W,(c)Dze
    Fig. 9. The precipitation cloud on August 7,2019(a)Ka-band radar Ze,Ka,(b)W-band radar Ze,W,(c)Dze
    The precipitation cloud on August 7, 2019(a)Altitude distribution of Dze,(b)Dze histogram distribution
    Fig. 10. The precipitation cloud on August 7, 2019(a)Altitude distribution of Dze,(b)Dze histogram distribution
    The precipitation cloud on August 7,2019(a)Ka-band Radar V,(b)W-band Radar V,(c)The VDiff
    Fig. 11. The precipitation cloud on August 7,2019(a)Ka-band Radar V,(b)W-band Radar V,(c)The VDiff
    VDiff histogram distribution(a)above melting-layer,(b)below melting-layer
    Fig. 12. VDiff histogram distribution(a)above melting-layer,(b)below melting-layer
    The snowfall cloud on March 14,2020(a)Ka-band radar Ze,Ka,(b)W-band radar Ze,W,(c)Dze
    Fig. 13. The snowfall cloud on March 14,2020(a)Ka-band radar Ze,Ka,(b)W-band radar Ze,W,(c)Dze
    The snowfall cloud on March 14, 2020(a)Dze histogram distribution, and(b)Z histogram distribution of W-band radar while the Ka-band radar no echo
    Fig. 14. The snowfall cloud on March 14, 2020(a)Dze histogram distribution, and(b)Z histogram distribution of W-band radar while the Ka-band radar no echo
    The snowfall cloud on March 14,2020(a)Ka-band Radar VKa,(b)W-band Radar VW,and(c)The VDiff
    Fig. 15. The snowfall cloud on March 14,2020(a)Ka-band Radar VKa,(b)W-band Radar VW,and(c)The VDiff
    The snowfall cloud on March 14, 2020(a)scatter plot of V of Ka-band and W-band, and(b)VDiff histogram distribution
    Fig. 16. The snowfall cloud on March 14, 2020(a)scatter plot of V of Ka-band and W-band, and(b)VDiff histogram distribution
    参数符号说 明单 位W波段Ka波段
    λ雷达工作波长cm0.320.86
    Pt发射机峰值功率kW1.53
    τ发射脉冲宽度us0.50.5
    Φ水平波束宽度(°)0.160.39
    θ垂直波束宽度(°)0.160.42
    G天线增益dB59.1152.89
    L馈线总损耗(双程)dB3.83
    B接收带宽M22
    Fn噪声系数dB6.84.7
    C0雷达常数dB64.766.42
    Prmin接收灵敏度dBm-104.19-106.29
    Table 1. Dual-wavelength millimeter-wave cloud radar specifications
    Yong-Heng BI, Juan HUO, Da-Ren LYU, Tao SU, Xue-Rong WANG, Bo LIU. Ka&W dual-frequency millimeter-wave cloud radar at Yangbajing ---Performance and comparison[J]. Journal of Infrared and Millimeter Waves, 2022, 41(2): 470
    Download Citation