• Photonics Research
  • Vol. 11, Issue 7, 1293 (2023)
Jing Zhao1、3、†, Xianfeng Wu2、†, Di Cao2、†, Mingchao Zhou2, Zhijie Shen2, and Xiaopeng Zhao2、*
Author Affiliations
  • 1Medtronic plc, Boulder, Colorado 80301, USA
  • 2Smart Materials Laboratory, Department of Applied Physics, Northwestern Polytechnical University, Xi’an 710129, China
  • 3e-mail: zhaojing1120@gmail.com
  • show less
    DOI: 10.1364/PRJ.482542 Cite this Article Set citation alerts
    Jing Zhao, Xianfeng Wu, Di Cao, Mingchao Zhou, Zhijie Shen, Xiaopeng Zhao. Broadband omnidirectional visible spectral metamaterials[J]. Photonics Research, 2023, 11(7): 1293 Copy Citation Text show less
    Schematic and behavior of broadband omnidirectional meta-clusters system. (a) Negative refraction response of cluster system. (b) Structure of single cluster. (c) Cluster unit of broadband omnidirectional meta-clusters system (12×1×1); through the response bands of 480 nm, 500 nm, 530 nm, 550 nm, 570 nm, 590 nm, 620 nm, 640 nm, 660 nm, 680 nm, 700 nm, and 720 nm, the 12 cluster combinations basically cover the visible range and realize the response of visible light in broadband.
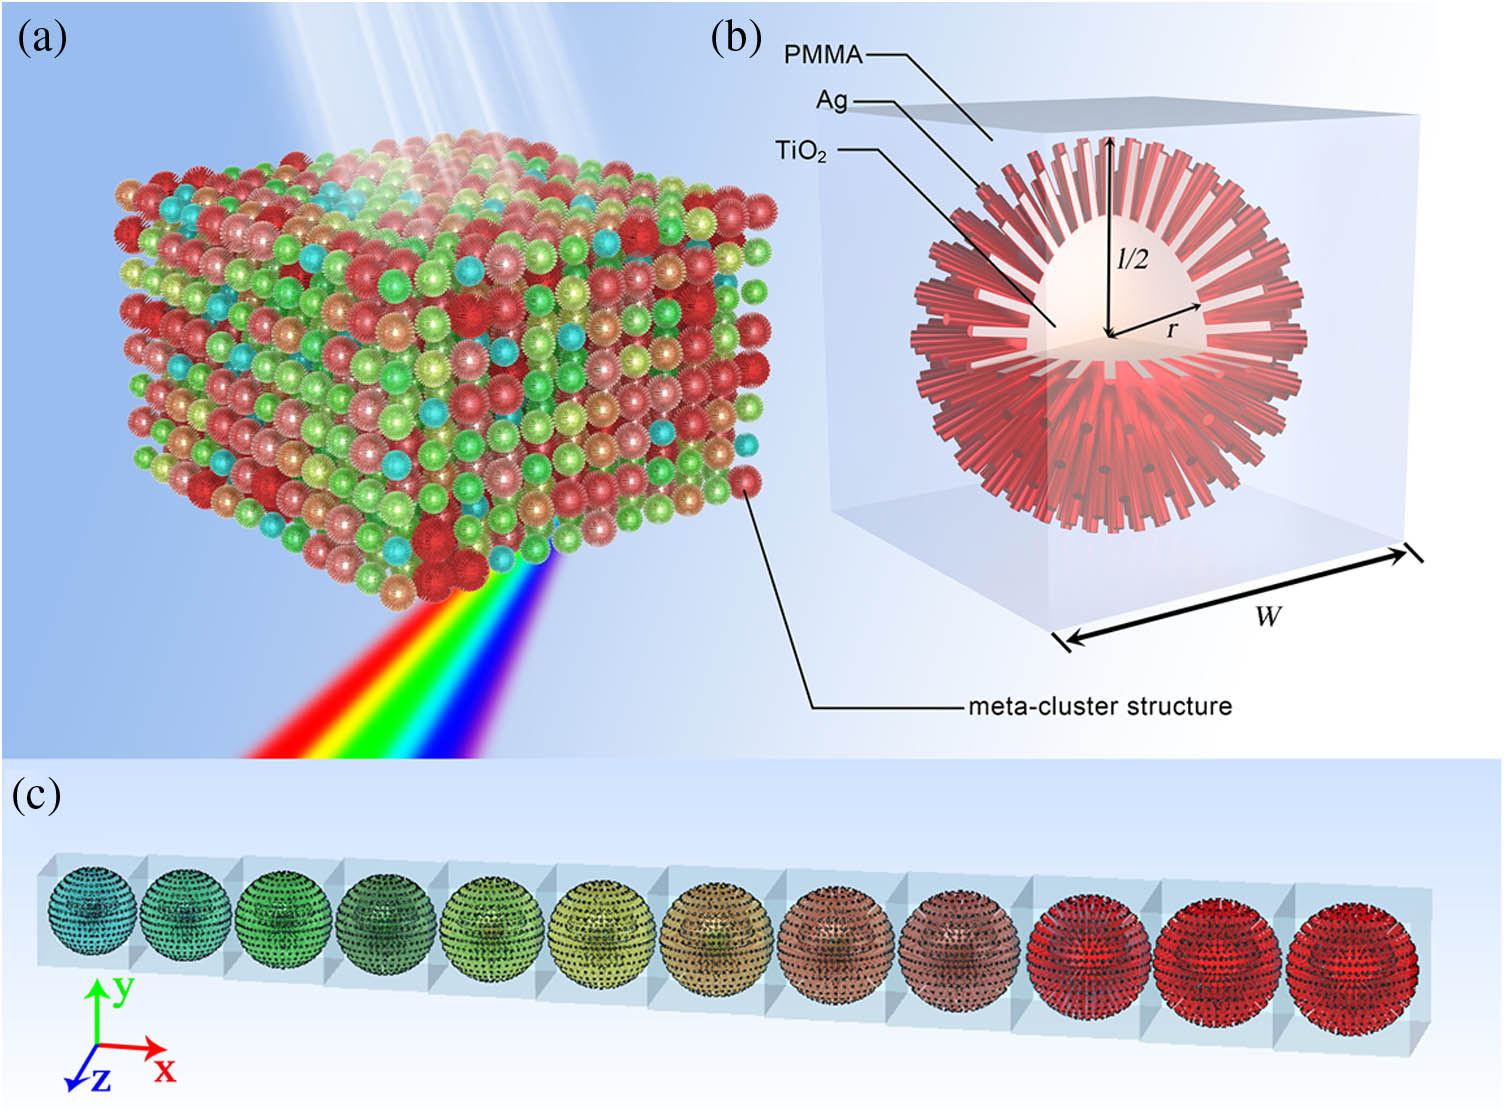
    Fig. 1. Schematic and behavior of broadband omnidirectional meta-clusters system. (a) Negative refraction response of cluster system. (b) Structure of single cluster. (c) Cluster unit of broadband omnidirectional meta-clusters system (12×1×1); through the response bands of 480 nm, 500 nm, 530 nm, 550 nm, 570 nm, 590 nm, 620 nm, 640 nm, 660 nm, 680 nm, 700 nm, and 720 nm, the 12 cluster combinations basically cover the visible range and realize the response of visible light in broadband.
    Simulated behavior of meta-cluster structure. (a)–(d) Meta-cluster model in blue-light, green-light, yellow-light, and red-light wavebands, respectively. The cluster is composed of a spherical core and 600 prominent rods; both the kernel and rods are made of TiO2 coated by Ag of 1 nm thickness. The diameter of the rod is 15 nm. l represents the diameter of the meta-cluster, r is the radius of the spherical kernel, and W refers to the lattice constant of the meta-cluster. Parameters are (a) l=480 nm, r=146 nm, and W=510 nm; (b) l=530 nm, r=165 nm, and W=560; (c) l=590 nm, r=198 nm, and W=620 nm; and (d) l=640 nm, r=215 nm, and W=670 nm. (e)–(h) Transmission (solid line) and reflection (dotted–dashed line) coefficient curves of the meta-clusters in (a)–(d), correspondingly. (i)–(l) Effective parameters (permeability, permittivity, and refractive index) retrieved from the coefficients in (e)–(h), respectively. (m) Simulated results of the model composed of two green-light meta-clusters with l=530 nm, r=165 nm, W=560 nm and l=550 nm, r=184 nm, W=580 nm. (n) Simulated results of the model composed of two red-light meta-clusters with l=640 nm, r=215 nm, W=670 nm and l=660 nm, r=221 nm, W=690 nm. (o) Negative refractive index curve in visible light broadband obtained by parameter inversion using Mie theory. (p) FOM curve of quality factor corresponding to (o). In (o) and (p), the green and red dotted lines are the simulated results of the single-frequency models [31] corresponding to the green and red bands, respectively.
    Fig. 2. Simulated behavior of meta-cluster structure. (a)–(d) Meta-cluster model in blue-light, green-light, yellow-light, and red-light wavebands, respectively. The cluster is composed of a spherical core and 600 prominent rods; both the kernel and rods are made of TiO2 coated by Ag of 1 nm thickness. The diameter of the rod is 15 nm. l represents the diameter of the meta-cluster, r is the radius of the spherical kernel, and W refers to the lattice constant of the meta-cluster. Parameters are (a) l=480  nm, r=146  nm, and W=510  nm; (b) l=530  nm, r=165  nm, and W=560; (c) l=590  nm, r=198  nm, and W=620  nm; and (d) l=640  nm, r=215  nm, and W=670  nm. (e)–(h) Transmission (solid line) and reflection (dotted–dashed line) coefficient curves of the meta-clusters in (a)–(d), correspondingly. (i)–(l) Effective parameters (permeability, permittivity, and refractive index) retrieved from the coefficients in (e)–(h), respectively. (m) Simulated results of the model composed of two green-light meta-clusters with l=530  nm, r=165  nm, W=560  nm and l=550  nm, r=184  nm, W=580  nm. (n) Simulated results of the model composed of two red-light meta-clusters with l=640  nm, r=215  nm, W=670  nm and l=660  nm, r=221  nm, W=690  nm. (o) Negative refractive index curve in visible light broadband obtained by parameter inversion using Mie theory. (p) FOM curve of quality factor corresponding to (o). In (o) and (p), the green and red dotted lines are the simulated results of the single-frequency models [31] corresponding to the green and red bands, respectively.
    Morphology and characterization of the Ag/AgCl/TiO2@PMMA particles resonating in visible light broadband. TEM images of Ag/AgCl/TiO2@PMMA particles: (a) red-light particle, (b) yellow-light particle, and (c) green-light particle. (d) SEM image of the monolayer film of the broadband metamaterial, which is obtained by mixing eight kinds of single-frequency Ag/AgCl/TiO2@PMMA particles.
    Fig. 3. Morphology and characterization of the Ag/AgCl/TiO2@PMMA particles resonating in visible light broadband. TEM images of Ag/AgCl/TiO2@PMMA particles: (a) red-light particle, (b) yellow-light particle, and (c) green-light particle. (d) SEM image of the monolayer film of the broadband metamaterial, which is obtained by mixing eight kinds of single-frequency Ag/AgCl/TiO2@PMMA particles.
    Characterization of plane and 3D wedge-shaped broadband samples. (a) Plane SEM image and photograph image (the inset) of the broadband thin film sample and (b) corresponding side SEM image. (c) Microscope image of 3D wedge-shaped broadband sample and (d) corresponding SEM image, wedge angle ∼1.4°. (e) Normalized transmittance curves of broadband film sample (green line) and eight single-frequency samples (dotted line). (f) Refractive index curve measured for broadband sample SB. The cyan dashed line is the simulated value of the broadband model from Fig. 2(o). (g) Experimental FOM values of sample SB. Green and red curves in (f) and (g) are measured for green sample SG and red sample SR [31], respectively.
    Fig. 4. Characterization of plane and 3D wedge-shaped broadband samples. (a) Plane SEM image and photograph image (the inset) of the broadband thin film sample and (b) corresponding side SEM image. (c) Microscope image of 3D wedge-shaped broadband sample and (d) corresponding SEM image, wedge angle 1.4°. (e) Normalized transmittance curves of broadband film sample (green line) and eight single-frequency samples (dotted line). (f) Refractive index curve measured for broadband sample SB. The cyan dashed line is the simulated value of the broadband model from Fig. 2(o). (g) Experimental FOM values of sample SB. Green and red curves in (f) and (g) are measured for green sample SG and red sample SR [31], respectively.
    Doppler effect measurement. (a) Schematic of the reference optical path when the sample moves. The size of wedge-shaped sample is 5 mm×2 mm, wedge angle θ=1.55°, hence the allowed distance of movement is 2 mm for the laser beam. (b) and (c) Waveform map and power spectrum density map of the beat frequency signal obtained at v=140 μm/s. The theoretical and measured values of beat frequency Δf and inverse Doppler frequency shift (f1−f0)k for broadband sample. (d) at 532 nm (green dots and curves) and 589 nm (yellow dots and curves), (e) at 632.8 nm (red dots and curves) and 671 nm (brown dots and curves); and (f) the theoretical and measured values of beat frequency Δf and Doppler frequency shift (f1−f0)k for broadband sample at 473 nm (blue dots and curves) and for K9 crystal [31] at 532 nm (black dots and curves).
    Fig. 5. Doppler effect measurement. (a) Schematic of the reference optical path when the sample moves. The size of wedge-shaped sample is 5mm×2mm, wedge angle θ=1.55°, hence the allowed distance of movement is 2 mm for the laser beam. (b) and (c) Waveform map and power spectrum density map of the beat frequency signal obtained at v=140  μm/s. The theoretical and measured values of beat frequency Δf and inverse Doppler frequency shift (f1f0)k for broadband sample. (d) at 532 nm (green dots and curves) and 589 nm (yellow dots and curves), (e) at 632.8 nm (red dots and curves) and 671 nm (brown dots and curves); and (f) the theoretical and measured values of beat frequency Δf and Doppler frequency shift (f1f0)k for broadband sample at 473 nm (blue dots and curves) and for K9 crystal [31] at 532 nm (black dots and curves).
    Jing Zhao, Xianfeng Wu, Di Cao, Mingchao Zhou, Zhijie Shen, Xiaopeng Zhao. Broadband omnidirectional visible spectral metamaterials[J]. Photonics Research, 2023, 11(7): 1293
    Download Citation