
Anguo Dong, Jiaxun Li, Bei Zhang, Miaomiao Liang. Hyperspectral Image Classification Algorithm Based on Spectral Clustering and Sparse Representation[J]. Acta Optica Sinica, 2017, 37(8): 0828005
- Acta Optica Sinica
- Vol. 37, Issue 8, 0828005 (2017)
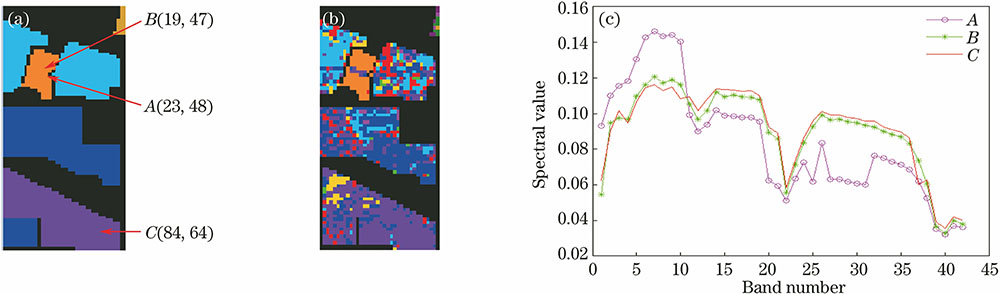
Fig. 1. Hyperspectral images. (a) Category of real ground; (b) classification result of OMP algorithm; (c) spectral curves
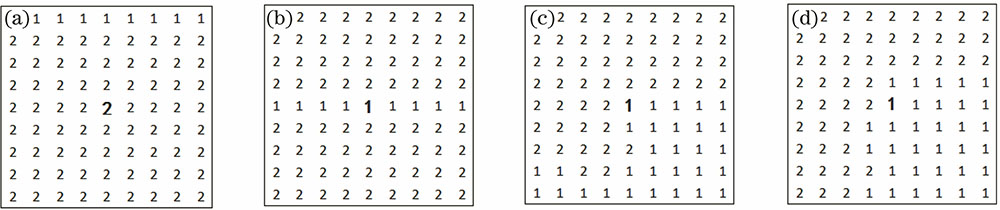
Fig. 2. Clustering results of ground in the neighborhood. (a) (129,35); (b) (96,39); (c) (38,52); (d) (100,58)
Fig. 3. Contrast figures before and after algorithm correction. (a) Before correction; (b) after correction
Fig. 4. Classification results of Pavia University dataset obtained by different algorithms. (a) Original image; (b) real ground; (c) SVM algorithm; (d) CK-SVM algorithm; (e) OMP algorithm; (f) SOMP algorithm; (g) MASR algorithm; (h) SC-SOMP algorithm
Fig. 5. Classification results of Indian Pines dataset obtained by different algorithms. (a) Original image; (b) real ground; (c) SVM algorithm; (d) CK-SVM algorithm; (e) OMP algorithm; (f) SOMP algorithm; (g) MASR algorithm; (h) SC-SOMP algorithm
Fig. 6. Classification results of Salinas Valley dataset obtained by different algorithms. (a) Original image; (b) real ground; (c) SVM algorithm; (d) CK-SVM algorithm; (e) OMP algorithm; (f) SOMP algorithm; (g) MASR algorithm; (h) SC-SOMP algorithm
Fig. 7. Effect of the number of training samples. (a) Pavia University; (b) Indian Pines; (c) Salinas Valley
| ||||||||||||||||||||||||||||||||||||||||||||||||||||||||||||||||||||||||||||||||||||||||||||||||||||||||||||||||||||||||||||||||||||||||||||||||
Table 1. Experimental data and classification accuracies of the Pavia University dataset
| |||||||||||||||||||||||||||
Table 2. Classification accuracies of Indian Pines dataset obtained by different algorithms
| |||||||||||||||||||||||||||
Table 3. Classification accuracies of Salinas Valley dataset obtained by different algorithms

Set citation alerts for the article
Please enter your email address
© Copyright 2018-2021 | Chinese Laser Press. All Rights Reserved 沪ICP备15018463号-20