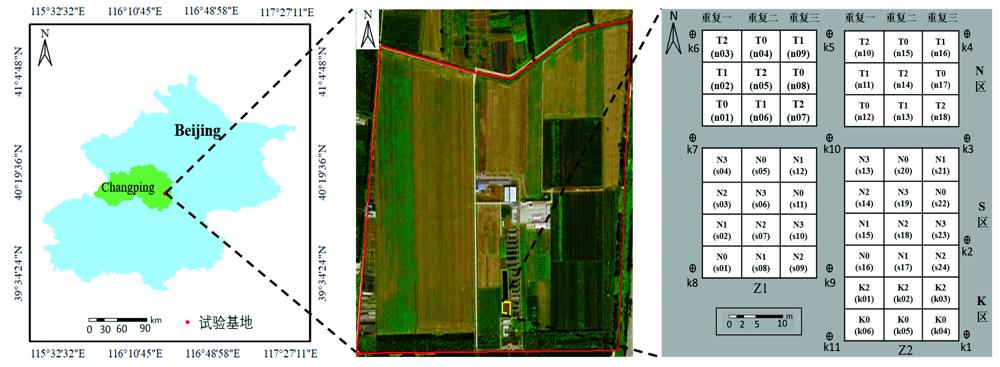
Fig. 1. Potato field location and experiment design
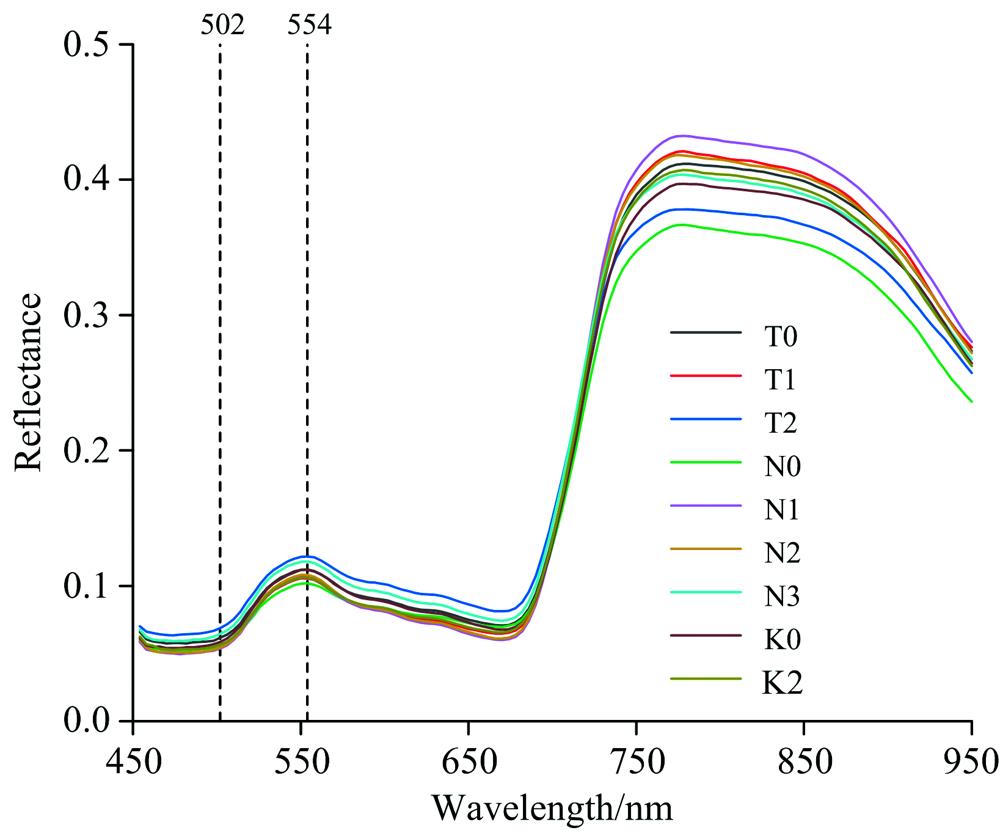
Fig. 2. Spectral reflectance curves of potato in tuber formation period
Fig. 3. Comparative analysis of extracted plant height and measured plant height of potato
Fig. 4. Comparative analysis of potato extraction coverage and measured coverage
Fig. 5. Correlation analysis results of extraction parameters and plant nitrogen content at different growth stages
Note: dotted line represents the correlation significant at 0.01 level
Fig. 6. PNC estimation of potato based on FFPs using PLSR
Fig. 7. PNC estimation of potato based on FFPs using ANN
数码相机传感器 | 参数值 | 高光谱传感器 | 参数值 |
---|
类型 | CMOS | 型号 | UHD185 | 镜头 | FOV 84° | 尺寸/(mm×mm×mm) | 195×67×60 | 快门速度/s | 8~1/8 000 | 相机质量/g | 470 | 有效像素/万 | 2 000 | 波谱范围/nm | 450~950 | 对焦距离/自动 | 1 m~无穷远 | 采样间隔/nm | 4 | 照片尺寸 | 4 864×3 648 | 光谱分辨率/nm | 8 |
|
Table 1. Sensor parameters
生育期 | OGEP | 建模 | 验证 |
---|
R2 | RMSE/% | NRMSE/% | R2 | RMSE/% | NRMSE/% |
---|
现蕾期 | Dsum | 0.54 | 0.55 | 14.97 | 0.77 | 0.37 | 14.21 | 块茎形成期 | Dsum | 0.44 | 0.46 | 14.53 | 0.80 | 0.37 | 14.32 | 块茎增长期 | Dg/Dgmin | 0.47 | 0.44 | 16.46 | 0.48 | 0.39 | 16.63 | 淀粉积累期 | Rmax | 0.47 | 0.34 | 11.92 | 0.45 | 0.36 | 11.54 | 成熟期 | Dsum | 0.49 | 0.37 | 14.02 | 0.31 | 0.37 | 13.33 |
|
Table 2. PNC of potato estimated by using optimal green edge parameter
生育期 | OFFP | 建模 | 验证 |
---|
R2 | RMSE/% | NRMSE/% | R2 | RMSE/% | NRMSE/% |
---|
现蕾期 | SDg/1+VCuav | 0.68 | 0.46 | 12.50 | 0.77 | 0.38 | 11.29 | 块茎形成期 | SDg/1+VCuav | 0.67 | 0.35 | 11.07 | 0.86 | 0.25 | 10.41 | 块茎增长期 | Dsum/1+VCuav | 0.78 | 0.281 | 0.52 | 0.76 | 0.25 | 10.14 | 淀粉积累期 | Dsum/1+VCuav | 0.53 | 0.34 | 11.35 | 0.72 | 0.30 | 10.82 | 成熟期 | Dg/1+VCuav | 0.30 | 0.43 | 16.47 | 0.47 | 0.38 | 16.43 |
|
Table 3. Estimated values of potato PNC with optimal fusion feature parameters
生育 期 | 模型 变量 | PLSR | ANN |
---|
建模 | 验证 | 建模 | 验证 |
---|
R2 | RMSE /% | NRMSE /% | R2 | RMSE /% | NRMSE /% | R2 | RMSE /% | NRMSE /% | R2 | RMSE /% | NRMSE /% | P1 | GEPs | 0.73 | 0.42 | 11.61 | 0.77 | 0.41 | 10.47 | 0.77 | 0.43 | 11.89 | 0.81 | 0.39 | 10.09 | FFPs | 0.74 | 0.41 | 11.35 | 0.78 | 0.41 | 10.48 | 0.84 | 0.34 | 9.30 | 0.86 | 0.32 | 8.08 | P2 | GEPs | 0.72 | 0.32 | 10.30 | 0.68 | 0.35 | 10.38 | 0.74 | 0.33 | 10.47 | 0.72 | 0.40 | 12.03 | FFPs | 0.77 | 0.29 | 9.32 | 0.85 | 0.28 | 8.55 | 0.80 | 0.27 | 8.70 | 0.84 | 0.30 | 8.96 | P3 | GEPs | 0.50 | 0.42 | 15.94 | 0.62 | 0.34 | 12.25 | 0.57 | 0.39 | 14.72 | 0.67 | 0.30 | 10.93 | FFPs | 0.79 | 0.28 | 10.38 | 0.77 | 0.25 | 9.22 | 0.83 | 0.25 | 9.51 | 0.79 | 0.25 | 9.09 | P4 | GEPs | 0.47 | 0.34 | 11.9 | 10.47 | 0.36 | 11.50 | 0.55 | 0.33 | 11.56 | 0.50 | 0.36 | 11.36 | FFPs | 0.67 | 0.29 | 9.71 | 0.73 | 0.29 | 10.53 | 0.71 | 0.27 | 9.05 | 0.74 | 0.29 | 10.44 | P5 | GEPs | 0.53 | 0.35 | 13.5 | 10.47 | 0.34 | 12.18 | 0.64 | 0.32 | 12.22 | 0.46 | 0.33 | 11.88 | FFPs | 0.37 | 0.41 | 15.57 | 0.51 | 0.33 | 11.98 | 0.53 | 0.36 | 13.66 | 0.42 | 0.34 | 12.16 |
|
Table 4. PNC estimations of potato at different growth stages by using PLSR and ANN