
Yu-Xuan Ren, Joshua Lamstein, Chensong Zhang, Claudio Conti, Demetrios N. Christodoulides, Zhigang Chen. Biophotonic rogue waves in red blood cell suspensions[J]. Photonics Research, 2023, 11(11): 1838
- Photonics Research
- Vol. 11, Issue 11, 1838 (2023)
Abstract
1. INTRODUCTION
Rogue waves (RWs) represent one type of extremely large amplitude wave phenomena, occurring as rare events with non-predictability [1–4]. Originally found in the ocean, RWs appear as a complex interaction between waves of different frequencies and amplitudes. The large amplitude of the waves can cause disasters for ships; thus, oceanic RWs have attracted a great deal of attention [5,6]. The physics behind these natural phenomena has been extensively investigated, with laboratory experiments in various material systems including water [7–9], nonlinear crystals [10–12], fluid surfaces [13], nonlinear optical cavities [14], atomic vapors [15], and super-continuum optical fibers [16,17], to name just several. For example, in a fiber laser cavity, due to the interplay of nonlinearity and dispersion, laser pulses exhibit interesting shapes including soliton molecules and optical RWs [18–20]. A disordered photonic lattice can also support RWs [21]. Recently, it has been shown that optical RWs can be suppressed by using structured beams in a saturable nonlinear medium [22]. Conventionally, RWs are typically considered to be attributed to modulational instability [8,10,16,23], or to the collision processes in the deterministic solutions of the nonlinear Schrödinger equations (NLSE) [2,24–27] (e.g., Peregrine soliton [28], Akhmediev breathers [29], and Kuznetsov-Ma solitons [30]). However, spontaneous synchronization of waves with different spatial frequencies in a linear system can also lead to events with rogue-like behavior, as has been observed in scattering media [31], acoustic waves [32], microwaves [33], and integrated microchip resonators [33,34]. A linear system typically demands artificial perturbation, obstruction, or strong tailoring of the phase to excite the RWs [15,31,35]. Although several attempts tried to understand the mechanism for RW formation without nonlinearity, it is still a subject of debate and active investigation [35–37]. Usually, the bright localized spots created in an RW have anomalously large intensities with extremely rare probability, so the probability density function (PDF) with long-tail statistics is used to identify the RWs [3,16,35]. RWs are generally considered as unpredictable, in either hydrodynamics [4] or optics [18,38]. Nevertheless, recent advances in the neural network have led to prediction of the evolution of breaking waves with trained network using a large dataset of existing observations [39–41], so RW prediction may be achievable.
Biological cells in a natural environment often display a plethora of geometries and can experience natural phase modulation with random fluctuations. For instance, normal human red blood cells (RBCs) with a biconcave shape [42,43] can act as random scatterers of light in a fluid environment. The average diameter of RBCs is about 7 μm, with a thickness around 3 μm. RBCs fill nearly half of the blood in human circulation system, and their plasticity enables them to carry oxygen from the lung to the body through the narrow vasculature [44]. RBCs in a natural suspension experience collisions with molecules and cells of various species in the fluid environment. Due to the inhomogeneous refractive indices of different components, a light beam propagating through an RBC suspension will experience strong scattering and phase modulation. The global phase modulation accumulated from multiple-cell scattering can be well approximated by a superposition of the Zernike function series [45]. This global phase modulation allows for the breakup of the beam wavefront, creating spatial filaments. Most of the filaments are spatially incoherent and hard to constructively interfere, while probabilistically some may grow into stronger ones if the adjacent filaments are “spontaneously synchronized” within a certain frequency band in the presence of Brownian motion [25,34]. Although nonlinear response of bio-soft matter can lead to modulation instability and formation of soliton-like beams [46–51], the creation of RWs in a biological suspension such as with RBCs has not been realized. In a recent study, it has been shown that tumor-cell spheroids can manifest optical RWs when illuminated by randomly modulated laser beams [52].
In this work, we report the observation of biophotonic RW-like events in RBC suspensions driven by light scattering and Brownian motion. Cell-mediated phase modulation provides a speckle-like optical energy landscape, which induces either constructive or destructive interference [53]. The spatial RW appears at highly localized regions with extremely large depths of potential wells. We observe that, even in a nearly linear regime (weak light illumination of RBC suspensions), time-dependent phase modulations driven by the Brownian motion can support RWs [54]. We perform a series of control experiments with regular polystyrene beads of different sizes and find that the RWs are produced in the Mie scattering regime. By increasing the optical power so that the light–matter interaction takes place, the RBC suspension approximates an optical Kerr nonlinearity with the cells experiencing both scattering and gradient forces, which can change the effective nonlinear response. However, in contradistinction with results from polystyrene bead suspensions, at high powers, the optical nonlinearity leads to altogether a different probability distribution.
Sign up for Photonics Research TOC. Get the latest issue of Photonics Research delivered right to you!Sign up now
2. EXPERIMENTAL SETUP AND DESCRIPTION
A continuous-wave (CW) laser (MGL-F-532, DPSS) operating at passes through a half-wave plate (WPM05M-532, Thorlabs) and a polarizing beam splitter (PBS251, Thorlabs) for power adjustment [Fig. 1(a)]. The beam is expanded and collimated by a telescope consisting of a pair of lenses (, ) to a diameter of approximately 5 mm. In the linear propagation case, the collimated beam is directly sent to the 40-mm-long cuvette filled with an RBC suspension, while in the nonlinear propagation case the collimated beam is focused by an achromatic lens () at the front facet of the cuvette to a size of about 20 μm (FWHM). As the light beam propagates through the suspension, it evolves into a speckle-like pattern. The rear surface of the cuvette is imaged via a lens (), and the time-evolution of the speckle pattern is digitalized and recorded using a high-resolution CCD camera (LaserCAM-HR II, 2/3”, Coherent, Inc.) assisted with BeamView imaging software (Coherent, Inc.). Depending on the experiment, typically a video with 100–500 frames is taken and collected for data analysis, which corresponds to a time course of about 20–100 s. Experiments are performed at various laser wavelengths using a tunable Ti:sapphire laser (M Square).
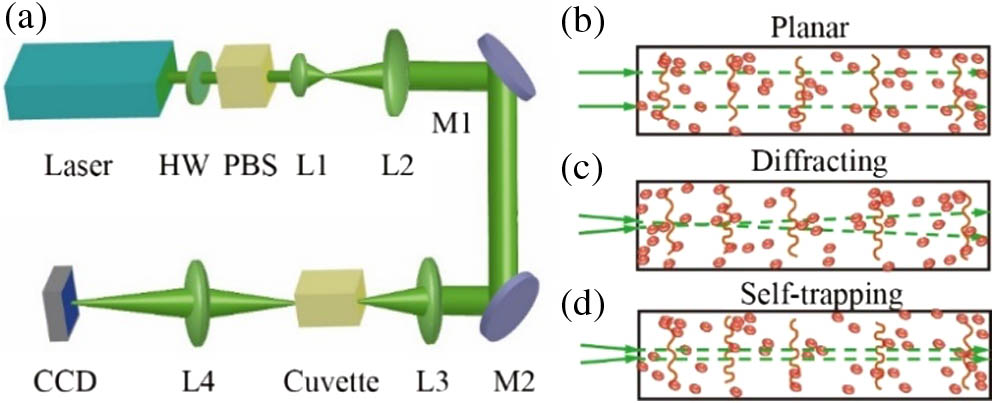
Figure 1.(a) Experimental setup for observing wave dynamics in RBC suspensions. Laser, 532 nm wavelength; HW, half-wave plate; PBS, polarizing beam splitter; L1 through L4, lenses; M1, M2, reflective mirrors; CCD, charge-coupled device. (b)–(d) Illustrations of (b) linear propagation of a plane wave illumination, (c) linear diffraction of a focused beam at low power, and (d) nonlinear self-focusing at high power.
For the nonlinear propagation discussed in a later section, the experiment is performed separately with a high-power coherent CW laser operating at (Verdi V5, Coherent Inc.). The beam is spatially uniform and sufficiently large (about 2 cm) relative to the entrance dimension of the cuvette containing the RBC suspension. The output dynamics of the beam is captured with a high-resolution fast camera (Prosilica GE1050, 1st Vision). The images are collected at an acquisition speed of 80 fps (frames per second). A typical video of 2000 frames saved on the disk is used for off-line analysis, which corresponds to a total time duration of about 25 s.
Three experimental scenarios are illustrated in Figs. 1(b)–1(d). First, in order to minimize the nonlinear effects, we send a broad collimated beam (approximately a plane wave) into the suspension, and the beam propagation is mostly determined by random phase modulation regulated by Brownian motion in the linear regime [Fig. 1(b)]. Second, with a somewhat focused beam launched into the suspension, the beam experiences linear diffraction at a low power [Fig. 1(c)], but it can turn into a self-trapped soliton-like beam once the nonlinearity is sufficiently increased [Fig. 1(d)].
3. EXPERIMENTAL RESULTS AND ANALYSIS
A. Biological RW Events Triggered by Brownian Motion
The focused beam has a Gaussian distribution with an FWHM spot size of approximately 20 μm. The rear facet of the cuvette containing the cell suspension is imaged onto a high dynamic range CCD camera [55,56]. The experimental output exhibits a speckle-like pattern with intense spots sparsely scattered at the exit plane [Fig. 2(a)]. Long-crested and steep waves are observed on the random pattern [squared region in Fig. 2(a) and zoom-in 3D plot in Fig. 2(b)]. In the linear case, the PDF of the speckle pattern is well approximated by an exponential distribution, , where is the average background intensity. Statistical characterization of the random pattern suggests that the intensity histogram presents an L-shaped long tail [Fig. 2(c)]. As used in Refs. [6,37], when the intensity is above twice of the average of the top third events (significant wave heights), it indicates the threshold [vertical dashed line, Fig. 2(c)] for RW events is reached.
![]()
Figure 2.Observation of biophotonic RWs in an RBC suspension. (a) Speckle-like pattern observed in an RBC suspension, in which rare spikes with a giant intensity appear. (b) 3D intensity profile of the zoomed region marked by a white square in (a) demonstrates one rogue event (an intensity “hot spot”). (c) The intensity histogram suggests long-tail statistics where the RW threshold is marked by dashed blue line (a.u., arbitrary unit). (d) The 1D spatial spectrum of the speckle-like pattern shows a broad Gaussian distribution with a bandwidth of
The reciprocal space of the rogue event is characterized by the broadband spectrum, which is corroborated in various systems including the fiber optics [16]. To evaluate the spatial spectrum of the produced patterns , we calculate the 2D spectra,
A conventional optical RW is either a localized intense spot in the spatial coordinate [10,11] or a confined intensity at spatiotemporal space [16]. We demonstrate that a biophotonic RW not only happens in the form of a localized spot but also appears abruptly and disappears in a considerably short period of time [57]. Such temporal property is characterized in the spatiotemporal diagram recording the time evolution of intensity along one spatial axis. Figure 2(e) shows a sequential intensity fluctuation at an individual pixel on the camera, where a giant intensity event of about times the average is marked in red at (FWHM 0.23 s). Although the spatial and temporal locations are unpredictable, interestingly, we found that by just monitoring the intensity evolution at a certain pixel, the RW event occurs again at a later time. The time interval between two consecutive RWs is defined as the return time. We scan across a 40,000-pixel region in a video to inspect the return time at a defined location. Figure 2(f) shows the return time histogram for the RW events in normal isotonic buffer. The probability of return time fits well to an exponential curve (solid curve) with a characteristic time of .
B. RW Probability Controlled by Scattering
The erythrocytes in the blood change their position and speed due to flow and Brownian motion to deliver nutrients and remove waste products [58]. There is no consistent effect on the statistics of cell dynamics within the pathophysiologically relevant range of densities (15%–45%) [58]. The haematocrit and mean cell volume for erythrocyte are quite stable but can vary by 20% among individuals. This is due to the plasticity of the cell membrane, which enables the transportation among vesicles of various sizes. The scattering coefficient increases with concentration (haematocrit) across a broad range, while the anisotropy factor remains constant at a high value () at visible wavelength [44]. Such a broad range of variation in cell geometry offers tremendous degrees of freedom to tailor the scattering output. Here, we specifically investigate how the scattering output is affected by the cell concentration.
In particular, the biophotonic RW is observed in the erythrocyte suspension with concentration 1000-fold smaller than that in the native blood (with unseparated but mixed cells); thus, the scattering increases linearly with the concentration of RBCs. For easy comparison, the concentration is normalized to . The penetrated light experiences random modulation on the phase by the RBCs driven by Brownian motion, and the output breaks up into filaments [Fig. 3(a)]. Such filaments suggest a broadband spatial spectrum [Fig. 3(b)]. Waves with different amplitudes and phases can constructively interfere to form rogue-like events. The FWHM of the spatial spectrum increases with enhanced scattering that occurs at higher cell concentrations at all laser power levels tested [Fig. 3(c)]. The spatial spectrum broadens as the concentration of RBCs increases, and this trend supports that the multiple scattering strength augments at high concentration. Spikes satisfying intensity criteria are categorized as RWs, where is the average intensity (see Appendix A). However, the RW probability first sharply increases and then gradually decreases with the concentration [Fig. 3(d)]. Although the FWHM shows no significant change across a broad range of laser powers with moderate nonlinearity (50–200 mW), the maximum RW probability happens at a lower concentration for large nonlinearity [Fig. 3(d)]. This confirms that, as the power (and thus nonlinearity) increases, the local particle concentration also increases. At higher power levels, even a low-concentration suspension can produce appreciable RW events.
![]()
Figure 3.RW event probability regulated by cell concentrations. (a) The spatial output of a 532 nm laser beam passing through the RBC suspension in isotonic buffer. (b) The corresponding spatial spectrum suggests a broadband distribution. (c) The FWHM for the spatial spectrum varies with the cell concentration. (d) RW probability as a function of cell concentration. The incident powers for each curve are labeled in the legend. Scale bars: (a) 15 μm, (b)
The cells in RBC suspensions can model a salt concentration-driven optofluidic microlens with variable focal distances [45]. In an isotonic buffer, the RBCs have a disk-like shape, and cells with different orientations scatter the incident light to different directions. The diffracted wavefront at the exit pupil of the RBC microlens is expressed as a linear superposition of Zernike polynomials, . Only two quadratic polynomial terms with Zernike coefficients of order 4 and 12 contribute significantly to the focal properties of the RBCs, while other terms are negligible [45]. The effective scattering phase function for whole blood has been approximated by Henyey–Greenstein phase functions [59], which has been verified by the angle-resolved scattering intensity measurements. Meanwhile, the cells in the suspension are experiencing both the rotational and translational Brownian motion thanks to the collisions of the liquid molecules. The light propagating through the RBC suspension experiences random self-phase modulation associated with the concentration-dependent scattering. At a low concentration, the scattering is weak, and the phase modulation depth is not sufficient to excite appreciable RW events. The phase modulation depth increases with concentration until the phase modulation reaches maximum at a threshold concentration; then further increase of concentration will suppress the Brownian motion since the cell MPF is reduced in a more crowded environment, thus decreasing the chance to observe an RW event. Therefore, the strongest rogue event seems to happen only in a certain concentration range.
4. DISCUSSION
A. RW Events under Various Physiological Conditions of RBCs
In an isotonic solution, where the osmolarity outside the cell equals that inside, the erythrocyte has a disk-like biconcave shape. A light beam normal to the cell will be diverged with a broader distribution of the -vector in the reciprocal space [Fig. 4(a)]. For RBCs with arbitrary orientation, the phase modulation profile will be more complex. RBCs normally do not have an orientation preference and suffer from random Brownian motion in the buffer. Therefore, the scattering-induced phase modulation will be time-dependent, providing more chances to excite stochastic constructive interference. The spectrum broadening increases with cell concentration as evidenced in Fig. 3(c).
![]()
Figure 4.Measured event probability and maximum strength of RWs in RBC suspensions under different osmotic conditions. (a) An isotonic RBC has a biconcave shape and diverges the beam. (b) A hypotonic or hypertonic RBC assumes a spherical shape and converges the beam. (c) RW probability with RBC suspensions in hypotonic (black), isotonic (red), and hypertonic (pink) buffer. (d) Maximum strength of RW events in RBC suspensions under different osmotic conditions.
The shape of the erythrocyte deforms in response to environmental stimuli, such as local ion concentration, blood pressure, and geometric confinement of the vessel [45]. In particular, the cell will change shape in an unbalanced physiological buffer with a broadband salt concentration range while maintaining the membrane structure [45]. In a hypotonic solution, the erythrocyte takes in water and swells into a sphere. In a hypertonic solution, the erythrocyte loses water and becomes crenated with an irregular shape and an inhomogeneous size, and the cell shape approximates a sphere with an irregular surface. Intuitively, the spherical microbead acts as a positive lens with an equivalent focal length , with being the radius of the sphere [Fig. 4(b)] [60]. Thus, the suspension of erythrocytes in an unbalanced buffer will also scatter the light, and the cell position is associated with the Brownian motion. The shape and orientation of a discocyte RBC contribute to the inhomogeneity of the cell suspension.
We analyze the RW probability and the maximum strength to characterize and compare the performance under various physiological conditions. The stronger the intensity, the more likely it is to be an RW. We choose a relatively high concentration of , in which the Brownian motion will be partially inhibited, and compare the RW probability of RBCs in hypotonic, isotonic, and hypertonic solutions. The expanded spherical RBC in hypotonic solution produces fewer RWs because of the inhibited Brownian motion and smaller refractive index contrast with the background medium (hemoglobin in cell is diluted). We also observed that the crenate RBC produces a reduced number of RWs compared to the biconcave RBCs [Fig. 4(c)]. This is partially due to the inhibited Brownian motion and the Rayleigh scattering caused by the irregular shape, despite the increase in the effective refractive index due to concentrated hemoglobin. Meanwhile, the rogue events produced by discocyte RBCs (isotonic solution) have stronger maximum intensity, while the spherical (hypotonic) and irregularly shaped (hypertonic) RBCs produce RWs with a smaller maximum strength [Fig. 4(d)].
B. Interplay of Mie Scattering and Brownian Motion
We identified that the RW is associated with Mie scattering-induced phase modulation. To verify, we performed experiments with suspensions of Rayleigh particles (), and no RW was observed. This is experimentally confirmed as the light beam diffracts normally with a complete beam envelope in the suspension containing 100 nm diameter polystyrene or 200 nm poly(methyl methacrylate) (PMMA) nanospheres. For a particle size close to the wavelength (), the beam starts to form filaments as verified by observation of the speckle-like pattern in suspensions of 1 μm polystyrene spheres. Surprisingly, those speckle-like patterns do not satisfy the RW criteria.
The RW is observed in the Mie scattering regime (), as evidenced by suspensions of silica or polystyrene microspheres ranging from 2 to 10 μm. Analogous to RBCs, the microsphere can be modeled as a random phase generator. Stronger intensity hot spots appear in the diffraction pattern of 5 μm polystyrene sphere suspensions [Fig. 5(a)], and these hot spots stretch out the intensity distribution with a characteristic long tail. The probability to observe an RW varies with the size of the sphere [Fig. 5(b)]. Once the size of the microsphere increases to 11 μm, the speckle size also increases, and the chance to find a strong intensity hot spot is reduced [Figs. 5(b) and 5(c)]. The size of the micro-object can also regulate the strength of the rogue events due to the interplay of scattering and Brownian motion. The RW has a maximum strength when using the polystyrene beads of a diameter 5 μm, while those with 2 μm and 11 μm provide a maximum strength at a lower level [Fig. 5(c)]. As the maximum strength is greater than the RW threshold, the RWs are found in each of the frames for 2 μm and 5 μm bead suspensions [Fig. 5(c)]. The 11 μm bead case, however, has a less intense maximum intensity, and the maximum intensity in some frames is even below the criteria value for RWs. Since large beads may have slower Brownian motion and weaker Mie scattering, the large bead suspension has a lower likelihood for forming RWs. Our observation suggests that the interplay of Mie scattering and Brownian motion plays a major role in mediating the RW events in dielectric suspensions.
![]()
Figure 5.RW events measured in polystyrene (spherical bead) suspensions for comparison. (a) Typical frame for light scattering in a suspension of 5 μm polystyrene beads showing two (“hot-spot”) rogue events. (b) RW probability varies with time for beads with different sizes, where three traces for different sizes are measured separately and concatenated for better visualization. (c) The ratio of the maximum over average intensities changes with time from the video series. Traces in (b) and (c) are for polystyrene beads with diameter 2 μm (black), 5 μm (red), and 11 μm (pink).
5. NONLINEARITY-MEDIATED RW EVENTS
In the previous discussion, although the power was kept at a low level of 10 mW, the suspension is weakly nonlinear. To fully reduce the nonlinear effect, thus providing a nearly linear environment, a plane wave is used to further reduce the input power intensity and to examine the RW events. As the local concentration of erythrocytes does not change dramatically with the plane-wave-like light illumination, we identified similar giant events as shown in Fig. 6(a). Direct observation of the intensity at single pixel shows temporal fluctuation, and one rogue event occurs at with FWHM of [Fig. 6(b)]. Apart from the green beam at 532 nm, similar rogue events are observed at near-infrared wavelengths by sending plane waves of 780 nm and 860 nm wavelengths to the isotonic erythrocyte suspension. Since all these wavelengths are smaller than the diameter of the RBC, the Mie scattering dominates, and thus the RW events are expected for all these wavelengths. Although the RW probability increases with the wavelength in the Mie regime [Fig. 6(c)], the mechanism for wavelength dependence is not clear. The existence and properties of the RWs in the Rayleigh scattering regime on RBC suspensions with longer infrared wavelengths also merit further investigation, as these infrared beams are widely used in biomedical equipment for diagnosis.
![]()
Figure 6.RW events observed with a plane wave illumination in isotonic RBC suspensions. (a) RW event captured in the nearly linear propagation regime. (b) Rogue event identified in the time-course signal taken at the chosen pixel. The duration of the RW is
For a weak nonlinearity, the RBCs are assumed to undergo merely Brownian motion, so a light beam experiences random phase modulation caused by the RBCs. As the power increases, the RBC motion would also be affected by the optical scattering and gradient forces, thus experiencing the optical nonlinearity [48–51]. Apart from the phase modulation, the optical force induced nonlinearity will also play an important role in the RW generation process. Since the size of the RBC is much greater than the light wavelength, the Mie regime applies for the evaluation of the optical force [61]. Effectively, the cells will be attracted into the light path, maximizing the chance of random scattering. The optical beam approximates a Kerr-type nonlinearity, and the refractive index variation depends on the intensity, , where is the Kerr coefficient and is the optical intensity [62,63]. To understand how the nonlinear effect plays the role, we focused the beam into a 2 cm cuvette and measured a critical power of 450 mW for self-trapping in suspension containing isotonic RBCs with concentration , which corresponds to a nonlinear refractive index of . At low power level (10 mW), the cell concentration in the beam path increases by . The output of the beam through RBC in isotonic buffer exhibits random speckle-like pattern with L-shape statistics [Figs. 7(a) and 7(b)].
![]()
Figure 7.Influence of focusing nonlinearity on RW statistics in RBC suspensions. (a), (b) Linear case when the laser beam shows no self-action at 10 mW. (c), (d) Nonlinear case when the laser beam shows self-focusing at 500 mW. The solid straight line in (b) shows an exponential fit, while the curved line in (d) represents a fit using a dual-exponential distribution function. (e)–(h) are the corresponding simulation for weak and strong nonlinear cases (a.u., arbitrary unit).
In the nonlinear case, due to the strong interaction of the beam and the RBC, the PDF is further stretched away from the exponential distribution. Meanwhile, the rogue events transit to soliton-like waves, and the PDF at high power (NL case) shows a dual-exponential shape, which could be modeled as, , where is the average soliton intensity. In the presence of strong nonlinearity when the laser power was then boosted up to 500 mW, the concentration inside the beam channel is increased to times the concentration outside the channel. This is confirmed by experimental observation where a clear red channel diffuses upon the removal of the beam. The range of the speckle-like pattern shrinks to a smaller size with increased scattering and bent statistics [Figs. 7(c) and 7(d)].
The behavior under weak and strong NL regimes is highly consistent with the simulation using the NLSE employing random phase modulation associated with Brownian motion. The light propagation in the biological sample is performed using the split beam propagation method (BPM). The cell has an optical refractive index discrepancy with the liquid environment and exerts a phase modulation on the beam filament passing through the cell due to inhomogeneous scattering and the discrepancy of the refractive indices between the cell and the environment. As an ansatz, the modulation of light adopts a random phase with a normal distribution, which considers the Brownian motion [64,65]. The optical force provides an optical potential, and the Brownian motion of cells will be confined within the random potential well. At low power, the optical beam starts to break up and forms speckle-like filaments [Fig. 7(e)]. The optical RW is a consequence of collisions of the speckles, which interfere constructively with each other. However, the constructive interference of those speckles happens with rare probability during light propagation in the suspension [Fig. 7(f)]. Statistical analysis of spatial pattern results in a long-tail histogram for the light intensity [Fig. 7(f)]. Once the intensity is boosted up to a strong nonlinear regime, the light intensity will be more localized to form soliton modes, increasing the chance for observing the higher intensity events [Fig. 7(g)]. This will break the definition of an RW, resulting in stretched statistics [Fig. 7(h)]. Meanwhile, the Brownian motion of cells is suppressed due to the increased concentration, and the cell suspension forms a waveguide [48].
6. CONCLUSION
Biological cell suspensions provide a natural system to modulate the phase of a light wavefront, and to create an environment to generate a filamented beam. With the random Brownian motion, these filaments may constructively interfere and evolve to RWs. We have observed the biophotonic analog of the oceanic RWs, characterized by extreme intensity peaks in both linear and weakly-nonlinear regimes. The RW events are unpredictable, with long-tail statistics and an unusual spatiotemporal distribution. Real-time measurements suggest that the RW is not only localized in the spatial domain, but also appears in a very short period of time and disappears abruptly. We have identified that such a rogue-wave-like phenomenon is associated with the interplay of Mie scattering and Brownian motion. In the nonlinear regime, the optical nonlinearity leads to completely different probability distributions, for both rogue-wave-like events and the formation of soliton-like patterns. Our work on the biophotonic RWs in RBC suspensions may be further developed for biomedical studies and devices in areas such as health diagnosis and disease prevention based on RBC analysis.
Acknowledgment
Acknowledgment. We thank Jorge R. Tredicce, Trevor S. Kelly, and Yong Sun for fruitful discussions, constructive comments, and assistance.
APPENDIX A: METHODS
Isotonic phosphate buffered saline (PBS), in which the cell maintains disk-like biconcave shape, serves as the working buffer for most of the experiment. The composition and concentrations of the PBS buffers are NaCl, 137 mmol/L, KCl, 2.7 mmol/L, , 10 mmol/L, , 1.8 mmol/L, and the final pH is adjusted to 7.4 with HCl. The NaCl concentration was changed to 69 mmol/L and 241 mmol/L for hypotonic and hypertonic buffers while the concentration of other salts keeps the same. Under normal physiological conditions, the RBC has an average mass of 27 pg in a volume of 100 fL [
Polystyrene beads with various sizes (200 nm, 1 μm, 2 μm, 3 μm, 5 μm, 11 μm) with mass density 1.05 g/mL and refractive index 1.59 are commercially available (Polysciences Inc.). The stock concentration of those microbeads is 2.5% solids (weight/volume, w/v) in aqueous suspensions. An aliquot of 20 μL stock solution is mixed with 6 mL water with a final concentration of 0.008% (w/v). As a comparison, all the polymer bead suspensions use the same concentration.
References
[2] M. Tlidi, M. Taki. Rogue waves in nonlinear optics. Adv. Opt. Photon., 14, 87-147(2022).
[5] M. Hopkin. Sea snapshots will map frequency of freak waves. Nature, 430, 492-493(2004).
[13] M. Shats, H. Punzmann, H. Xia. Capillary rogue waves. Phys. Rev. Lett., 104, 104503(2010).
[54] Y.-X. Ren, J. Lamstein, T. S. Kelly, C. Zhang, Y. Sun, C. Conti, D. N. Christodoulides, Z. Chen. Rogue waves in red blood cell suspensions. Conference on Lasers and Electro-Optics, FM4F.1(2017).
[63] A. J. Palmer. Nonlinear optics in aerosols. Opt. Lett., 5, 54-55(1980).
[66] R. A. McPherson, N. Vajpayee, M. R. Pincus, S. Graham, S. Bem. Basic examination of blood and bone marrow. Henry’s Clinical Diagnosis and Management by Laboratory Methods, 509-535(2011).

Set citation alerts for the article
Please enter your email address
© Copyright 2018-2021 | Chinese Laser Press. All Rights Reserved 沪ICP备15018463号-20