• Laser & Optoelectronics Progress
  • Vol. 58, Issue 23, 2325002 (2021)
Leran Wang1, Fulin Li2, Yixuan Sun1, Xiaojie Liu2, Lei Yang1、*, and Hongbo Xie1
Author Affiliations
  • 1Key Lab of Optoelectronic Information Technology of Education Ministry of China, School of Precision Instrument and Opto-Electronics Engineering, Tianjin University, Tianjin 300072, China
  • 2Hisense Visual Technology Co., Ltd., Qingdao , Shandong 266000, China
  • show less
    DOI: 10.3788/LOP202158.2325002 Cite this Article Set citation alerts
    Leran Wang, Fulin Li, Yixuan Sun, Xiaojie Liu, Lei Yang, Hongbo Xie. Optical Properties of Quantum Dots Color-Conversion Using Micro-LED Illumination[J]. Laser & Optoelectronics Progress, 2021, 58(23): 2325002 Copy Citation Text show less
    Flow chart of light source incident to quantum dot film
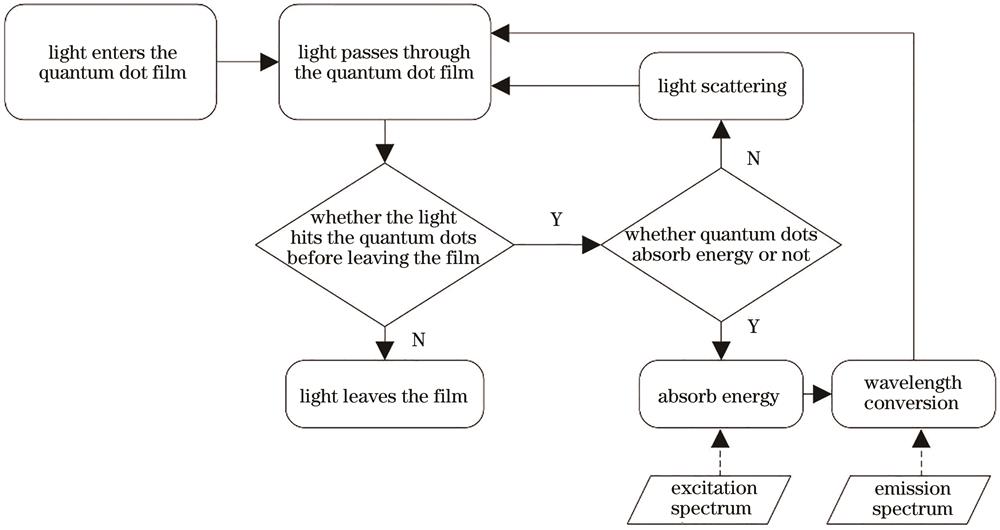
    Fig. 1. Flow chart of light source incident to quantum dot film
    Diagram of light transmission process in quantum dot materials
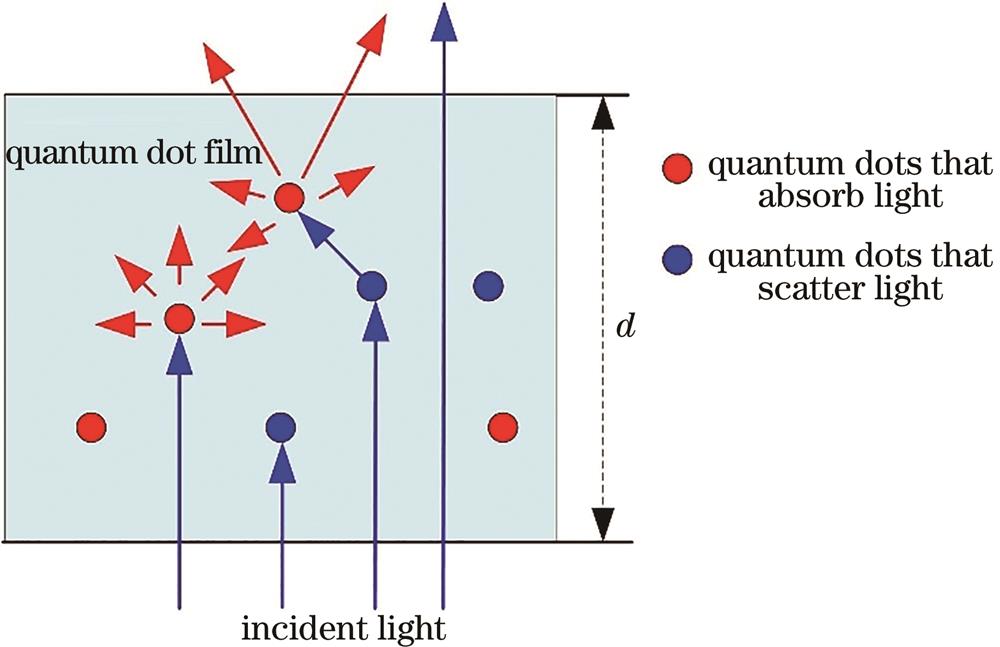
    Fig. 2. Diagram of light transmission process in quantum dot materials
    Scattering properties of quantum dots
    Fig. 3. Scattering properties of quantum dots
    Excitation spectrum. (a) Excitation spectrum of red quantum dots; (b) excitation spectrum of green quantum dots; (c) excitation spectrum of blue quantum dots
    Fig. 4. Excitation spectrum. (a) Excitation spectrum of red quantum dots; (b) excitation spectrum of green quantum dots; (c) excitation spectrum of blue quantum dots
    Emission spectrum. (a) Emission spectrum of red quantum dots; (b) emission spectrum of green quantum dots; (c) emission spectrum of blue quantum dots
    Fig. 5. Emission spectrum. (a) Emission spectrum of red quantum dots; (b) emission spectrum of green quantum dots; (c) emission spectrum of blue quantum dots
    Diagram of quantum dot parameter setting
    Fig. 6. Diagram of quantum dot parameter setting
    Spectrum of excitation source. (a) Blue light; (b) UV light
    Fig. 7. Spectrum of excitation source. (a) Blue light; (b) UV light
    Diagram of light source parameter setting
    Fig. 8. Diagram of light source parameter setting
    Diagram of separation of monomer quantum dot model
    Fig. 9. Diagram of separation of monomer quantum dot model
    Results for the red quantum dot thin film detector. (a) True color image of red quantum dots excited by ultraviolet light; (b) true color image of red quantum dots excited by blue light; (c) detector spectrum
    Fig. 10. Results for the red quantum dot thin film detector. (a) True color image of red quantum dots excited by ultraviolet light; (b) true color image of red quantum dots excited by blue light; (c) detector spectrum
    Results for the green quantum dot thin film detector. (a) True color image of green quantum dots excited by ultraviolet light; (b) true color image of green quantum dots excited by blue light; (c) detector spectrum
    Fig. 11. Results for the green quantum dot thin film detector. (a) True color image of green quantum dots excited by ultraviolet light; (b) true color image of green quantum dots excited by blue light; (c) detector spectrum
    Results for the blue quantum dot thin film detector. (a) True color image of blue quantum dots excited by ultraviolet light; (b) true color image of blue quantum dots excited by blue light; (c) detector spectrum
    Fig. 12. Results for the blue quantum dot thin film detector. (a) True color image of blue quantum dots excited by ultraviolet light; (b) true color image of blue quantum dots excited by blue light; (c) detector spectrum
    Color gamut of different light sources
    Fig. 13. Color gamut of different light sources
    Detector receiving spectrum. (a) Spectral curves corresponding to red quantum dots; (b) spectral curves corresponding to green quantum dots; (c) spectral curves corresponding to blue quantum dots
    Fig. 14. Detector receiving spectrum. (a) Spectral curves corresponding to red quantum dots; (b) spectral curves corresponding to green quantum dots; (c) spectral curves corresponding to blue quantum dots
    Ultraviolet region of the receiving spectrum. (a) Spectral curves corresponding to red quantum dots; (b) spectral curves corresponding to green quantum dots; (c) spectral curves corresponding to blue quantum dots
    Fig. 15. Ultraviolet region of the receiving spectrum. (a) Spectral curves corresponding to red quantum dots; (b) spectral curves corresponding to green quantum dots; (c) spectral curves corresponding to blue quantum dots
    Illuminance map of the detector when the light source changes from 0° to 90°. (a) Illuminance distribution of detector corresponding to red quantum dot film; (b) illuminance distribution of detector corresponding to green quantum dot film; (c) illuminance distribution of detector corresponding to blue quantum dot film
    Fig. 16. Illuminance map of the detector when the light source changes from 0° to 90°. (a) Illuminance distribution of detector corresponding to red quantum dot film; (b) illuminance distribution of detector corresponding to green quantum dot film; (c) illuminance distribution of detector corresponding to blue quantum dot film
    Schematic diagram of quantum dot film array model. (a) Array without microstructure; (b) array with microstructure; (c) array arranged in a striped pattern
    Fig. 17. Schematic diagram of quantum dot film array model. (a) Array without microstructure; (b) array with microstructure; (c) array arranged in a striped pattern
    True color image of array without microstructures. (a) Red quantum dots; (b) green quantum dots; (c) blue quantum dots
    Fig. 18. True color image of array without microstructures. (a) Red quantum dots; (b) green quantum dots; (c) blue quantum dots
    Illuminance map of array without microstructures. (a) Red quantum dots; (b) green quantum dots; (c) blue quantum dots
    Fig. 19. Illuminance map of array without microstructures. (a) Red quantum dots; (b) green quantum dots; (c) blue quantum dots
    True color image of array with microstructures. (a) Red quantum dots; (b) green quantum dots; (c) blue quantum dots
    Fig. 20. True color image of array with microstructures. (a) Red quantum dots; (b) green quantum dots; (c) blue quantum dots
    Illuminance map of array with microstructures. (a) Red quantum dots; (b) green quantum dots; (c) blue quantum dots
    Fig. 21. Illuminance map of array with microstructures. (a) Red quantum dots; (b) green quantum dots; (c) blue quantum dots
    Light distribution of quantum dots arrays. (a) Without microstructure; (b) with microstructure
    Fig. 22. Light distribution of quantum dots arrays. (a) Without microstructure; (b) with microstructure
    Leran Wang, Fulin Li, Yixuan Sun, Xiaojie Liu, Lei Yang, Hongbo Xie. Optical Properties of Quantum Dots Color-Conversion Using Micro-LED Illumination[J]. Laser & Optoelectronics Progress, 2021, 58(23): 2325002
    Download Citation