
Naohisa Hirao, Yuichi Akahama, Yasuo Ohishi. Equations of state of iron and nickel to the pressure at the center of the Earth[J]. Matter and Radiation at Extremes, 2022, 7(3): 038403
- Matter and Radiation at Extremes
- Vol. 7, Issue 3, 038403 (2022)
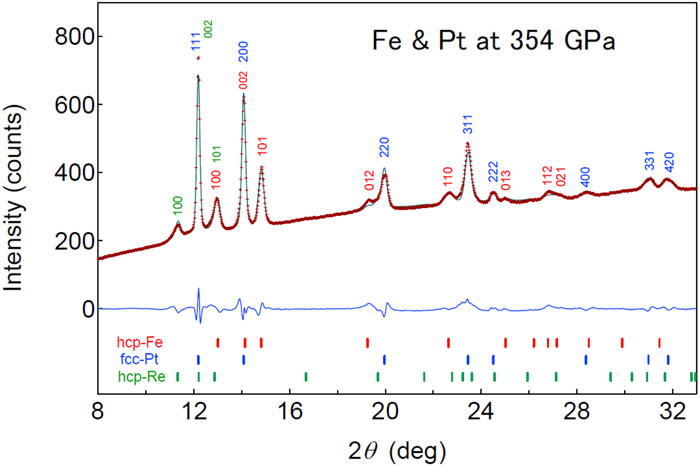
Fig. 1. Representative x-ray diffraction pattern (red crosses) and Rietveld simulation (green line) for hcp-Fe at 354 GPa. The blue line shows a residual. Lattice constants are calculated to be a = 2.1294(17) Å and c = 3.390(5) Å for hcp-Fe and a = 3.4049(11) Å for fcc-Pt.
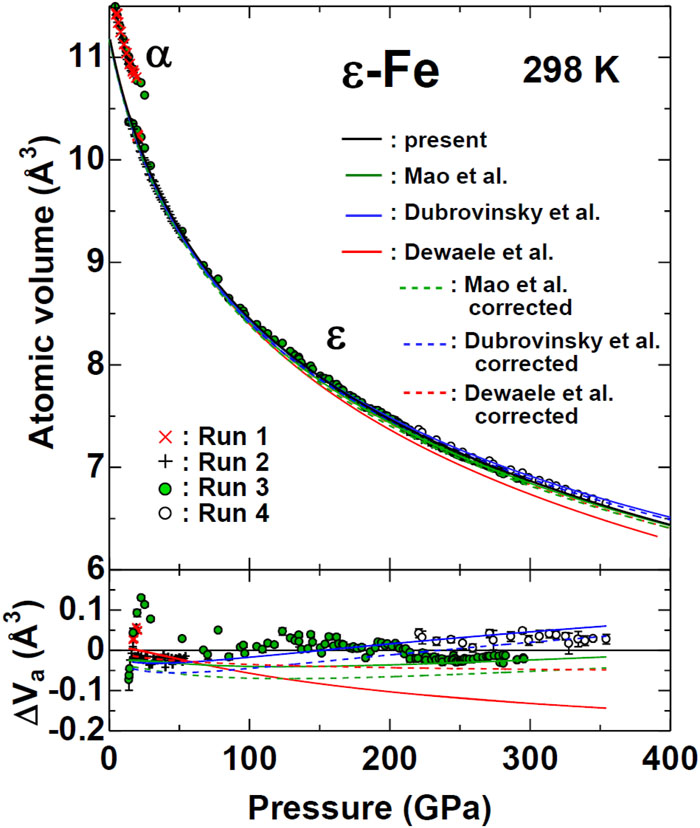
Fig. 2. Compression curve of Fe up to a pressure of 354 GPa, together with curves from previous reports. Solid black, green, blue, and red curves correspond to the experimental results of the present study and those conducted by Mao et al. ,3 Dubrovinsky et al. ,4 and Dewaele et al. ,5 respectively. ΔV a denotes the deviations of the atomic volume for each previous curve from the present one.
Fig. 3. Representative x-ray diffraction pattern (red crosses) and Rietveld simulation (blue line) for Ni at 368 GPa. The green line shows a residual. The estimated lattice constants a for fcc-Ni and fcc-Pt are 2.9521(10) and 3.3977(6) Å, respectively.
Fig. 4. Compression curve of Ni up to a pressure of 368 GPa, together with curves from previous reports. Solid black, green, and red curves are Vinet EOS fits to the experimental data from the present study, Kennedy and Keeler,14 and Dewaele et al. ,6 respectively.
Fig. 5. Gamma plots constructed using (a) the fcc-Pt data at 354 GPa from Table II , (b) the fcc-Pt data at 368 GPa from Table IV , and (c) the fcc-Ni data at 368 GPa from Table IV .
Fig. 6. Densities of Fe, Ni, and Fe0.91Ni0.09 at 298 K as functions of pressure. The Preliminary Reference Earth Model (PREM)37 is also shown for comparison.
|
Table 1. Conditions of each experimental run.
| ||||||||||||||||||||||||||||||||||||||||||||||||||||||||||||||||||||||||||||||||||||||||||||||||||||||||||||||||||||||||||||||||||
Table 2. 2θ and d-values (do) of the observed diffraction lines with λ = 0.4176 Å for the pattern at 354 GPa, indices for these lines, and calculated d-values (dc) for the hcp-Fe and fcc-Pt phases. Calculated lattice constants are also listed.
|
Table 3. Parameters of the Vinet EOS obtained by a least-squares fit of the experimental compression data for hcp-Fe, together with those from previous reports. The parameters of these EOSs are the atomic volume V0, bulk modulus K0, and its pressure derivative
| ||||||||||||||||||||||||||||||||||||||||||||||||||||||||||||||||||||||||||||||||||||||||||||||||||||||||||||||||||||
Table 4. 2θ and d-values (do) of the observed diffraction lines with λ = 0.4134 Å for the pattern at 368 GPa and indices for these lines and calculated d-values (dc) for the fcc-Ni and fcc-Pt phases. Calculated lattice constants are also listed.
|
Table 5. Parameters of the Vinet EOS obtained by a least-squares fit of the experimental compression data for Ni, together with those from previous reports. The parameters of these EOSs are the atomic volume V0, bulk modulus K0, and its pressure derivative


Set citation alerts for the article
Please enter your email address

© Copyright 2018-2021 | Chinese Laser Press. All Rights Reserved 沪ICP备15018463号-20