
Naohisa Hirao, Yuichi Akahama, Yasuo Ohishi. Equations of state of iron and nickel to the pressure at the center of the Earth[J]. Matter and Radiation at Extremes, 2022, 7(3): 038403
- Matter and Radiation at Extremes
- Vol. 7, Issue 3, 038403 (2022)
Abstract
I. INTRODUCTION
One of the most critical tasks in Earth and planetary science is to experimentally reproduce the 365 GPa pressure that is exerted on the iron (Fe) and nickel (Ni) that make up the Earth’s core. In this context, various technological developments have been achieved thus far. Recent advances in pressure generation technology using diamond anvil cells (DACs) have been remarkable. In addition to this, the synchrotron radiation from high-brilliance third-generation x-ray light sources enables high-pressure in situ x-ray observations to be made under the extremely high-pressure conditions (330 GPa and above) that exist at the Earth’s solid inner core.1
The Earth’s core is composed of iron containing some nickel and small amounts of light elements, such as hydrogen, carbon, oxygen, silicon, and sulfur. To understand the interior structure and the physical state of the Earth’s core, it is essential to determine the equations of state (EOSs) for these elements and their alloys under the extreme conditions corresponding to those at the core. Over the years, numerous experimental studies on room temperature and thermal EOSs for Fe, Fe–Ni alloys, and Fe–(Ni)–light-element alloys have been carried out under high-pressure and high-temperature conditions.2–15 Comparing possible EOSs with a seismological Earth model that yields the depth profiles of pressure, density, and elastic moduli provides constraints on the thermal and compositional models of the Earth’s core. The density of the Earth’s core is less than that of pure Fe, and this density deficit depends largely on the EOS of Fe. In addition, extrapolation of experimental data obtained below the pressure range at the core leads to significant errors. To obtain a thermal EOS under high-compression conditions, it is therefore extremely important to obtain reliable experimental pressure–volume (P–V) data on Fe, as well as Ni, in the pressure region corresponding to the Earth’s inner core, and to derive from these data accurate reference isothermal EOSs at room temperature.
However, the maximum pressure achieved in experiments to date has been limited to 300 GPa. In addition, the transition metal Ni is ferromagnetic, and its magnetic properties under high pressure need to be taken into account. It has been reported that Ni exhibits ferromagnetic order up to pressures exceeding 200 GPa at room temperature.16–18
On the other hand, the lack of a highly accurate pressure scale that can be used at 100 GPa or higher has also made it difficult to investigate the EOSs of these materials. Recently, however, quasi-absolute EOSs of gold (Au) and platinum (Pt) for first-order pressure scales have been proposed on the basis of high-precision measurements using a ramp (shockless) dynamic compression technique.19 The new Pt-EOS pressure scale shows a pressure (2.1 ± 0.3)% lower than the existing Pt-EOS derived from the shockwave reduced isotherm.20
In the study reported here, we performed in situ x-ray diffraction experiments on Fe and Ni using a DAC and succeeded in generating ultra-high pressures corresponding to the central region of the Earth. Based on the recently proposed Pt-EOS pressure scale, we established EOSs of Fe and Ni.
II. EXPERIMENTAL PROCEDURE
We have been able to extend the pressure limit for conventional DACs beyond 300 GPa through the following improvements: (1) optimization of the anvil shape such as by introducing a double-beveled geometry; (2) selection of ultra-low fluorescence (low levels of impurities) type Ia diamonds; (3) fine polishing of the surfaces of the culets of the diamond anvils to minimize microcracks on these surfaces.1,21 We have also upgraded the synchrotron radiation x-ray focusing technique to generate microfocused x-ray beams that are highly stable in both space and time, and we have improved the DAC sample alignment with the x-ray beams to micrometer precision.23,24
High-pressure powder x-ray diffraction measurements in DACs up to 370 GPa were performed on the BL10XU (or BL04B2) beamline, at the Super Photon Ring-8 GeV facility (SPring-8), Japan, using an angle-dispersive method that combined a 30 keV (or 28 and 37.8 keV) monochromatic x-ray beam and an x-ray area detector.22–24 On the BL10XU beamline, a combination of two compound refractive lenses (CRLs), fabricated from glassy carbon and an SU-8 polymer, was used to focus the x-ray beam onto the small sample. In experimental runs with anvil culet diameters less than 50 μm, the monochromatic x-ray beam was focused down to 4 (vertical) × 7 (horizontal) μm2 at the sample position using the x-ray CRLs. The focused beam size is defined as the full width at half maximum (FWHM) of the intensity profile. A pinhole, made of platinum and of diameter 8 μm, was located before the sample to remove the tail of the focused x-ray beam at the sample position.
Two-dimensional diffraction rings were recorded on an image plate detector (Rigaku R-AXIS IV or IV++) and integrated into the one-dimensional profile.25 The 2θ-intensity patterns were subsequently analyzed using the PDIndexer software package.26
The sample was either a high-purity Fe foil or high-purity sponge-like Ni powder and was embedded in a rhenium (Re) gasket. Four and five different experimental runs were conducted for Fe and Ni, respectively. Table I lists the experimental conditions for each run. For experimental runs with anvil culet diameters less than 50 µm, the precompressed sample of thickness 5 µm was cut into portions of diameter ∼10 µm, which were set into the sample chamber. A piece of Pt ∼1 µm thick and ∼5 µm in diameter was placed on the sample using a manipulator.
| Run No. | Diamond anvil geometry | PTM | Scale | P range (GPa) |
|---|---|---|---|---|
| Fe 1 | 500 | He | Pt + ruby | 5–20 |
| Fe 2 | 350 | He | Ruby | 0–54 |
| Fe 3 | 35/250/350 | None | Pt | 0–296 |
| Fe 4 | 28/250/350 | None | Pt | 219–354 |
| Ni 1 | 500 | MEW | Ruby | 0–10 |
| Ni 2 | 500 | He | Pt | 0–21 |
| Ni 3 | 100/300 | None | Pt | 2–179 |
| Ni 4 | 27/250/450 | None | Pt | 257–368 |
| Ni 5 | 50/230/450 | None | Pt | 163–202 |
Table 1. Conditions of each experimental run.
Two runs in the lower pressure range were performed under hydrostatic or quasi-hydrostatic conditions using a pressure-transmitting medium (PTM). The pressure was determined using a revised ruby scale derived from Dewaele’s ruby scale27 by correcting the pressure difference between the Pt-EOSs of Fratanduono et al.19 and Dewaele et al.27 (see Fig. S1 in the
III. RESULTS AND DISCUSSION
A. Iron
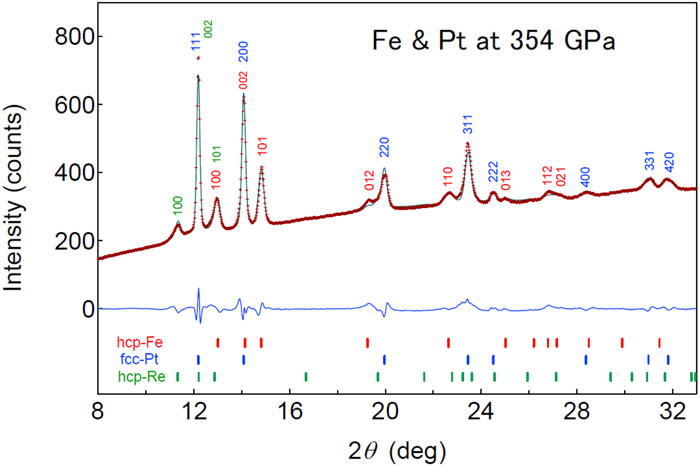
We observed that Fe underwent a phase transition from the body-centered cubic (bcc-Fe, or α-Fe) phase to the hexagonal close-packed (hcp-Fe, or ε-Fe) phase at ∼15 GPa under quasi-hydrostatic pressure at room temperature, which is in good agreement with the results of a previous study.29 In the present study, it was clarified that the hcp-Fe phase remained stable up to a maximum pressure of 354 GPa at 298 K, as shown in Fig. 1 (the observed diffraction image is shown in Fig. S3 in the
![]()
Figure 1.Representative x-ray diffraction pattern (red crosses) and Rietveld simulation (green line) for hcp-Fe at 354 GPa. The blue line shows a residual. Lattice constants are calculated to be
| 2θ (deg) | do (Å) | hcp-Fe | fcc-Pt | ||||
|---|---|---|---|---|---|---|---|
| a = 2.1294(17) (Å) | a = 3.4049(11) (Å) | ||||||
| c = 3.390(5) (Å) | |||||||
| Index | dc (Å) | do − dc (Å) | Index | dc (Å) | do − dc (Å) | ||
| 12.193 | 1.9661 | 111 | 1.9658 | 0.0003 | |||
| 12.970 | 1.8487 | 010 | 1.8441 | 0.0046 | |||
| 14.090 | 1.7024 | (002) | 200 | 1.7025 | −0.0001 | ||
| 14.833 | 1.6176 | 011 | 1.6200 | −0.0024 | |||
| 19.290 | 1.2463 | 012 | 1.2480 | −0.0017 | |||
| 20.004 | 1.2022 | 220 | 1.2038 | −0.0016 | |||
| 22.639 | 1.0638 | 110 | 1.0647 | −0.0009 | |||
| 23.451 | 1.0275 | 311 | 1.0266 | 0.0008 | |||
| 24.518 | 0.9834 | 222 | 0.9829 | 0.0005 | |||
| 25.003 | 0.9646 | 013 | 0.9636 | 0.0010 | |||
| 26.808 | 0.9007 | 112 | 0.9016 | −0.0009 | |||
| 27.113 | 0.8908 | 021 | 0.8897 | 0.0010 | |||
| 28.406 | 0.8510 | 400 | 0.8512 | −0.0002 | |||
Table 2. 2θ and d-values (do) of the observed diffraction lines with λ = 0.4176 Å for the pattern at 354 GPa, indices for these lines, and calculated d-values (dc) for the hcp-Fe and fcc-Pt phases. Calculated lattice constants are also listed.
Figure 2 shows the compression curve of hcp-Fe obtained from the pressure–volume (P–V) data at 298 K, together with the results of previous studies (P–V data for hcp-Fe are listed in Table SI in the
![]()
Figure 2.Compression curve of Fe up to a pressure of 354 GPa, together with curves from previous reports. Solid black, green, blue, and red curves correspond to the experimental results of the present study and those conducted by Mao
| V0 (Å3) | K0 (GPa) | P Range (GPa) | P Gauge | Formula | PTM | References | |
|---|---|---|---|---|---|---|---|
| 11.215(29) | 159.27(99) | 5.86(4) | 14–354 | Ruby or Pt | Vinet | He or none | Present |
| 11.176(17) | 164.8(3.6) | 5.33(9) | 35–300 | Pt | B-M | Ar or none | Mao et al. |
| 11.1780(2) | 160.67(5) | 5.36(1) | B-M | Corrected EOS | |||
| 11.1989 | 156 | 5.81 | 20–200 | Pt | B-M | None (heating) | Dubrovinsky et al. |
| 11.2022(1) | 151.65(2) | 5.854(3) | B-M | Corrected EOS | |||
| 11.214(49) | 163.4(7.9) | 5.38(16) | 17–197 | Ruby or W | Vinet | He | Dewaele et al. |
| 11.214 | 156.7(9) | 5.8(1.0) | Vinet | Corrected EOS |
Table 3. Parameters of the Vinet EOS obtained by a least-squares fit of the experimental compression data for hcp-Fe, together with those from previous reports. The parameters of these EOSs are the atomic volume V0, bulk modulus K0, and its pressure derivative
To compare the present and previously reported EOS curves, we extrapolated the previous EOS curves to 365 GPa. Furthermore, the pressures on the EOS curves of Mao et al.,3 Dubrovinsky et al.,4 and Dewaele et al.5 were corrected based on the latest Pt scale.14 The Pt-EOS curve reported by Dewaele et al.,5 which was determined based on the ruby scale proposed by Dewaele et al.,27 indicates a pressure lower by ∼25 GPa at 365 GPa on the latest Pt-EOS pressure scale. Therefore, their EOS curve for hcp-Fe before correction is below our EOS curve. The deviation of their atomic volume from the present EOS curve, ΔVa, at 365 GPa was −0.15 Å3. In other words, their EOS curve underestimates the volume by 2.3% at 365 GPa compared with our EOS curve. When the pressure value is corrected, ΔVa of the previous studies is within ±0.05 Å3, i.e., ±0.7% at 365 GPa. Therefore, it could be considered that this significant deviation of the EOS curve of Dewaele et al.5 is due to the pressure scale.
B. Nickel
At ambient pressure, the 3d transition metal Ni has a face-centered cubic (fcc) structure and does not show any structural phase transition up to 368 GPa, revealing that the fcc structure is stable up to the maximum pressure investigated in this study. In the diffraction pattern of 368 GPa shown in Fig. 3 (the diffraction image is shown in Fig. S3 in the
![]()
Figure 3.Representative x-ray diffraction pattern (red crosses) and Rietveld simulation (blue line) for Ni at 368 GPa. The green line shows a residual. The estimated lattice constants
| 2θ (deg) | do (Å) | fcc-Ni | fcc-Pt | ||||
|---|---|---|---|---|---|---|---|
| a = 2.9521(10) (Å) | a = 3.3977(6) (Å) | ||||||
| Index | dc (Å) | do − dc (Å) | Index | dc (Å) | do − dc (Å) | ||
| 12.048 | 1.9614 | 111 | 1.9616 | −0.0001 | |||
| 13.856 | 1.7065 | 111 | 1.7053 | 0.0011 | (200) | ||
| 16.008 | 1.4783 | 200 | 1.4769 | 0.0015 | |||
| 19.722 | 1.2020 | 220 | 1.2012 | 0.0008 | |||
| 22.757 | 1.0434 | 220 | 1.0443 | −0.0008 | |||
| 23.186 | 1.0243 | 311 | 1.0244 | −0.0001 | |||
| 24.244 | 0.9803 | 222 | 0.9808 | −0.0005 | |||
| 26.746 | 0.8900 | 311 | 0.8906 | −0.0005 | |||
| 27.969 | 0.8518 | 222 | 0.8527 | −0.0004 | (400) | ||
| 30.613 | 0.7798 | 331 | 0.7794 | 0.0003 | |||
| 31.446 | 0.7596 | 420 | 0.7597 | −0.0001 | |||
| 32.359 | 0.7387 | 400 | 0.7384 | 0.0001 | |||
Table 4. 2θ and d-values (do) of the observed diffraction lines with λ = 0.4134 Å for the pattern at 368 GPa and indices for these lines and calculated d-values (dc) for the fcc-Ni and fcc-Pt phases. Calculated lattice constants are also listed.
Figure 4 shows the pressure dependence of the atomic volume Va for fcc-Ni at 298 K obtained from five separate experimental runs, together with existing data.6,14 The present P–V data for Ni (Table SII in the
![]()
Figure 4.Compression curve of Ni up to a pressure of 368 GPa, together with curves from previous reports. Solid black, green, and red curves are Vinet EOS fits to the experimental data from the present study, Kennedy and Keeler,
| V0 (Å3) | K0 (GPa) | Method | P Range (GPa) | Formula | References | |
|---|---|---|---|---|---|---|
| 10.9376(4) | 173.5(1.4) | 5.55(5) | DAC | 0–368 | Vinet | Present |
| ⋯ | 183(3) | ⋯ | Ultrasonic | ⋯ | ⋯ | Yamamoto |
| 10.940 | 176.7(2.5) | 5.23(9) | DAC | 0–156 | Vinet | Dewaele et al. |
| 10.940 | 169.3(8) | 5.67(18) | Vinet | Corrected EOS | ||
| 10.9376 | 187.8(5) | 4.89(4) | Shock wave | 0–120 | Vinet | Kennedy and Keeler |
Table 5. Parameters of the Vinet EOS obtained by a least-squares fit of the experimental compression data for Ni, together with those from previous reports. The parameters of these EOSs are the atomic volume V0, bulk modulus K0, and its pressure derivative
By comparing the present data and the extrapolated curve from the previous report by Dewaele et al.,6 the latter underestimated the volume by ∼1.5% (ΔVa = −0.097 Å3) above 365 GPa. This discrepancy can also be attributed to the difference in the pressure scale. Dewaele et al.6 used their own calibrated ruby scale.27 Comparing the Pt-EOS27 obtained using this ruby scale with the latest Pt-EOS19 used in this study (see Fig. S1 in the
A sample compressed between two anvils without any PTM is generally under nonhydrostatic stress conditions. We examined the presence of nonhydrostatic stress using the diffraction data for fcc-Pt at 354 GPa and for fcc-Pt and fcc-Ni at 368 GPa, listed in Tables II and IV, respectively. The stress state in the diamond anvil sample possesses axial symmetry and can be defined by its components σ3 and σ1 in the axial and radial directions, respectively.33 The equivalent hydrostatic pressure and uniaxial stress component are given by σP = (σ3 + 2σ1)/3 and t = σ3 − σ1 ≤ σY = 2τ, respectively, where σY is the yield stress and τ is the shear strength of the sample material at σP.
For a cubic system,34 the am(hkl) vs 3(1–3 sin2 θ) Γ(hkl) plot (gamma plot) for the data obtained in the conventional (parallel) geometry can be approximated by a straight line with slope M1 and intercept M0, where
![]()
Figure 5.Gamma plots constructed using (a) the fcc-Pt data at 354 GPa from
C. Geophysical implication
Figure 6 shows the room-temperature densities of hcp-Fe and fcc-Ni as functions of pressure in the Earth’s core, compared with the density profile of the core from the seismic Preliminary Reference Earth Model (PREM).37 The new experimental compression data are essential because density data at the range of pressures in the Earth’s inner core can then be directly constrained without the need to extrapolate the data to inner core conditions. From the new EOSs based on our compression data at room temperature, the densities of hcp-Fe and fcc-Ni at 365 GPa are 14.10(5) and 15.16(7) g/cm3, respectively, and the densities at the pressure of the inner core boundary (ICB), 329 GPa, are 13.78(5) and 14.81(7) g/cm3, respectively. The density of hcp-Fe at the ICB pressure obtained from our data is in excellent agreement with the density, 13.8(1) g/cm3, from the previous compression EOS reported by Mao et al.3 using Pt as an internal pressure standard.
![]()
Figure 6.Densities of Fe, Ni, and Fe0.91Ni0.09 at 298 K as functions of pressure. The Preliminary Reference Earth Model (PREM)
According to cosmochemical data and studies of iron meteorites, the Earth’s core contains 5%–15% of Ni. The alloying of hcp-Fe with a small amount of Ni is expected to increase its density, because of the smaller atomic volume and larger atomic mass of Ni compared with pure hcp-Fe. The density of the Fe–Ni alloy can be estimated from our EOSs of Fe and Ni based on the mass fraction of Ni in Fe, because both Fe and Ni have a close-packed structure under high compression. The density of Fe0.9Ni0.1 was estimated to be 14.21(9) g/cm3 at 365 GPa and room temperature, which is greater than that of hcp-Fe by 0.11 g/cm3 (∼0.7%). Morrison et al.10 reported the EOS of Fe0.91Ni0.09 alloy from compression data up to 167 GPa. The density of Fe0.91Ni0.09 at 365 GPa and room temperature calculated from their results is ρ = 14.41 g/cm3. This is 1.4% larger than the value based on our EOS. This mismatch could reflect the difference between the pressure scales used. When the pressures from Morrison et al.10 were corrected using the pressure scales for tungsten (W)27 and Pt,19 the density of Fe0.91Ni0.09 at 365 GPa was recalculated to be ρ = 14.18 g/cm3, which is in agreement (within error) with our estimated value.
Further, it should be noted that in Fe-rich Fe–Ni alloys, the atomic volume of the hcp phase shows a positive compositional dependence in a relatively low-pressure range of 10–16 GPa.38 The dependence should at first sight be negative, because the atomic volume of Ni is smaller than that of Fe in the entire measurement pressure range, but the positive dependence suggests that a magnetic interaction between Fe and Ni atoms affects the volume of the alloys at lower pressures. However, under extremely high-pressure conditions, the disappearance of the magnetic interaction accompanied by a magnetic transition would be expected. Therefore, extrapolating the EOSs of these alloys obtained at low pressures to the much higher pressures beyond the limit of the data may lead to significant uncertainties in the P–V data. It is essential to measure the P–V data for these alloys up to the pressures relevant to the geophysical application in mind, namely, the Earth’s inner core conditions, using a reliable pressure scale.
IV. CONCLUSION
In this study, x-ray diffraction measurements of Fe and Ni were performed at pressures up to 354 and 368 GPa, respectively, and the EOS at 298 K was extended to the pressure at the center of the Earth using the latest Pt-EOS pressure scale. From a least-squares fitting to the Vinet equation of the observed P–V data, the values of K0 and
SUPPLEMENTARY MATERIAL
ACKNOWLEDGMENTS
Acknowledgment. This study was partially supported by JSPS KAKENHI Grant Nos. JP17·6708, JP19740332, and JP19K04051 to N.H. and Grant No. JP17K05550 to Y.A. This work was performed at the SPring-8 facility with the approval of the JASRI (Proposal Nos. 2005B0272, 2005B0307, 2006A1077, 2006A1307, 2006A1792, 2007A1277, 2007A1286, 2008B1247, 2009A1444, 2018B1144, and 2020A1194).
References
[1] Y.Akahama, N.Hirao, Y.Ohishi, A. K.Singh. Equation of state of bcc-Mo by static volume compression to 410 GPa. J. Appl. Phys., 116, 223504(2014).
[4] L. S.Dubrovinsky, T.LeBehan, S.Rekhi, S. K.Saxena, F.Tutti. In situ X-ray study of thermal expansion and phase transition of iron at multimegabar pressure. Phys. Rev. Lett., 84, 1720(2000).
[5] A.Dewaele, P. I.Dorogokupets, P.Loubeyre, M.Mezouar, F.Occelli, M.Torrent. Quasihydrostatic equation of state of iron above 2 Mbar. Phys. Rev. Lett., 97, 215504(2006).
[6] A.Dewaele, P.Loubeyre, M.Mezouar, M.Torrent. Compression curves of transition metals in the Mbar range: Experiments and projector augmented-wave calculations. Phys. Rev. B, 78, 104102(2008).
[7] K.Hirose, Y.Kuwayama, Y.Ohishi, N.Sata. Phase relations of iron and iron–nickel alloys up to 300 GPa: Implications for composition and structure of the Earth’s inner core. Earth Planet. Sci. Lett., 273, 379(2008).
[8] N.Hirao, I.Mashino, N.Nishitani, E.Ohtani, T.Sakai, S.Takahashi. Equation of state of pure iron and Fe0.9Ni0.1 alloy up to 3 Mbar. Phys. Earth Planet. Inter, 228, 114(2014).
[12] J.Badro, G.Fiquet, N.Guignot, J.Matas, F.Miozzi, J.Siebert. A new reference for the thermal equation of state of iron. Minerals, 10, 100(2020).
[13] D.Antonangeli, E.Boulard, A.Clark, F.Decremps, E.Edmund, G.Garbarino, M.Mezouar, F.Miozzi, G.Morard, V.Svitlyk. Axial compressibility and thermal equation of state of hcp Fe–5wt% Ni–5wt%Si. Minerals, 10, 98(2020).
[14] R.Keeler, G.Kennedy. American Institute of Physics Handbook, 38-105(1972).
[15] M.Yamamoto. On elastic constants of nickel crystals. Phys. Rev., 77, 566(1950).
[16] I. A.Abrikosov, S.Bornemann, A. I.Chumakov, L.Dubrovinsky, H.Ebert, M.Ekholm, I.Kantor, V.Potapkin, R.Rüffer, I.Sergueev, S. I.Simak, O. Y.Vekilova, M.Zaj?c. Hyperfine splitting and room-temperature ferromagnetism of Ni at multimegabar pressure. Phys. Rev. Lett., 111, 157601(2013).
[17] N.Ishimatsu, N.Kawamura, H.Maruyama, Y.Ohishi, O.Shimomura, M.Suzuki. Stability of ferromagnetism in Fe, Co, and Ni metals under high pressure. J. Phys. Soc. Jpn., 76, 064703(2007).
[18] P.Bruno, A.Dewaele, G.Garbarino, L.Genovese, Y. O.Kvashnin, P.Loubeyre, C.Marini, O.Mathon, F.Occelli, S.Pascarelli, R.Torchio. X-ray magnetic circular dichroism measurements in Ni up to 200 GPa: Resistant ferromagnetism. Phys. Rev. Lett., 107, 237202(2011).
[19] Y.Akahama, S. J.Ali, D. G.Braun, J. L.Brown, J.-P.Davis, J. H.Eggert, A.Fernandez-Pa?ella, D. E.Fratanduono, R. G.Kraus, M. C.Marshall, J. M.McNaney, M.Millot, E. F. O’Bannon, C. T.Seagle, R. F.Smith. Establishing gold and platinum standards to 1 terapascal using shockless compression. Science, 372, 1063(2021).
[20] G. R.Gathers, N. C.Holmes, J. A.Moriarty, W. J.Nellis. The equation of state of platinum to 660 GPa (6.6 Mbar). J. Appl. Phys., 66, 2962(1989).
[21] Y.Akahama, H.Kawamura. Recent advances in ultra-high pressure generation technology using diamond anvil cell: Challenge to the Frontier of static high-pressure generation. Rev. High Pressure Sci. Technol., 19, 248(2009).
[22] N.Hirao, K.Hirose, Y.Ohishi, N.Sata, M.Takata. Highly intense monochromatic X-ray diffraction facility for high-pressure research at SPring-8. High Pressure Res., 28, 163(2008).
[23] N.Hirao, K.Hirose, S. I.Kawaguchi, Y.Ohishi, E.Ohtani, K.Shimizu. New developments in high-pressure X-ray diffraction beamline for diamond anvil cell at SPring-8. Matter Radiat. Extremes, 5, 018403(2020).
[24] S.Goto, T.Ishikawa, M.Isshiki, Y.Ohishi, K.Takeshita. High-energy X-ray diffraction beamline: BL04B2 at SPring-8. Nucl. Instrum. Methods Phys. Res., Sect. A, 467-468, 663(2001).
[25] A. N.Fitch, A. P.Hammersley, M.Hanfland, D.Hausermann, S. O.Svensson. Two-dimensional detector software: From real detector to idealised image or two-theta scan. High Pressure Res., 14, 235(1996).
[26] T.Nagai, D.Nishio-Hamane, N.Sata, Y.Seto. Development of a software suite on X-ray diffraction experiments. Rev. High Pressure Sci. Technol., 20, 269(2010).
[27] A.Dewaele, P.Loubeyre, M.Mezouar. Equations of state of six metals above 94 GPa. Phys. Rev. B, 70, 094112(2004).
[28] Y.Akahama, H.Kawamura, A. K.Singh. Equation of state of bismuth to 222 GPa and comparison of gold and platinum pressure scales to 145 GPa. J. Appl. Phys., 92, 5892(2002).
[29] S.Anzellini, P.Cordier, C.Denoual, A.Dewaele, S.Merkel, M.Mezouar, F.Occelli, E.Rausch, M.Véron. Mechanism of the
[31] R. J.Angel, R. M.Hazen, M.Hazen R., R. T.Downs. Equation of state. High-Pressure and High-Temperature Crystal Chemistry, 35-60(2000).
[32] T.Ikeda, F.Izumi. A Rietveld-analysis program RIETAN-98. and its applications to zeolites. Mater. Sci. Forum, 321–324, 198(2000).
[33] A. K.Singh. The lattice strains in a specimen (cubic system) compressed nonhydrostatically in an opposed anvil device. J. Appl. Phys., 73, 4278(1993).
[34] C.Balasingh, R. J.Hemley, H.-k.Mao, J.Shu, A. K.Singh. Analysis of lattice strains measured under nonhydrostatic pressure. J. Appl. Phys., 83, 7567(1998).
[35] E.Menéndez-Proupin, A. K.Singh.
[36] T.?ain, B. M.Pettitt. Elastic constants of nickel: Variations with respect to temperature and pressure. Phys. Rev. B, 39, 12484(1989).
[37] D. L.Anderson, A. M.Dziewonski. Preliminary reference Earth model. Phys. Earth Planet. Inter., 25, 297(1981).
[38] Y.Akahama, Y.Fujimoto, T.Fukuda, N.Hirao, T.Kakeshita, S.Kawaguchi, Y.Ohishi, T.Terai. Pressure–composition phase diagram of Fe–Ni alloy. Mater. Trans., 61, 1058(2020).


Set citation alerts for the article
Please enter your email address

© Copyright 2018-2021 | Chinese Laser Press. All Rights Reserved 沪ICP备15018463号-20