
Qiong Wu, Qiang Li, Xin Guan. Optical Music Recognition Method Combining Multi-Scale Residual Convolutional Neural Network and Bi-Directional Simple Recurrent Units[J]. Laser & Optoelectronics Progress, 2020, 57(8): 081006
- Laser & Optoelectronics Progress
- Vol. 57, Issue 8, 081006 (2020)
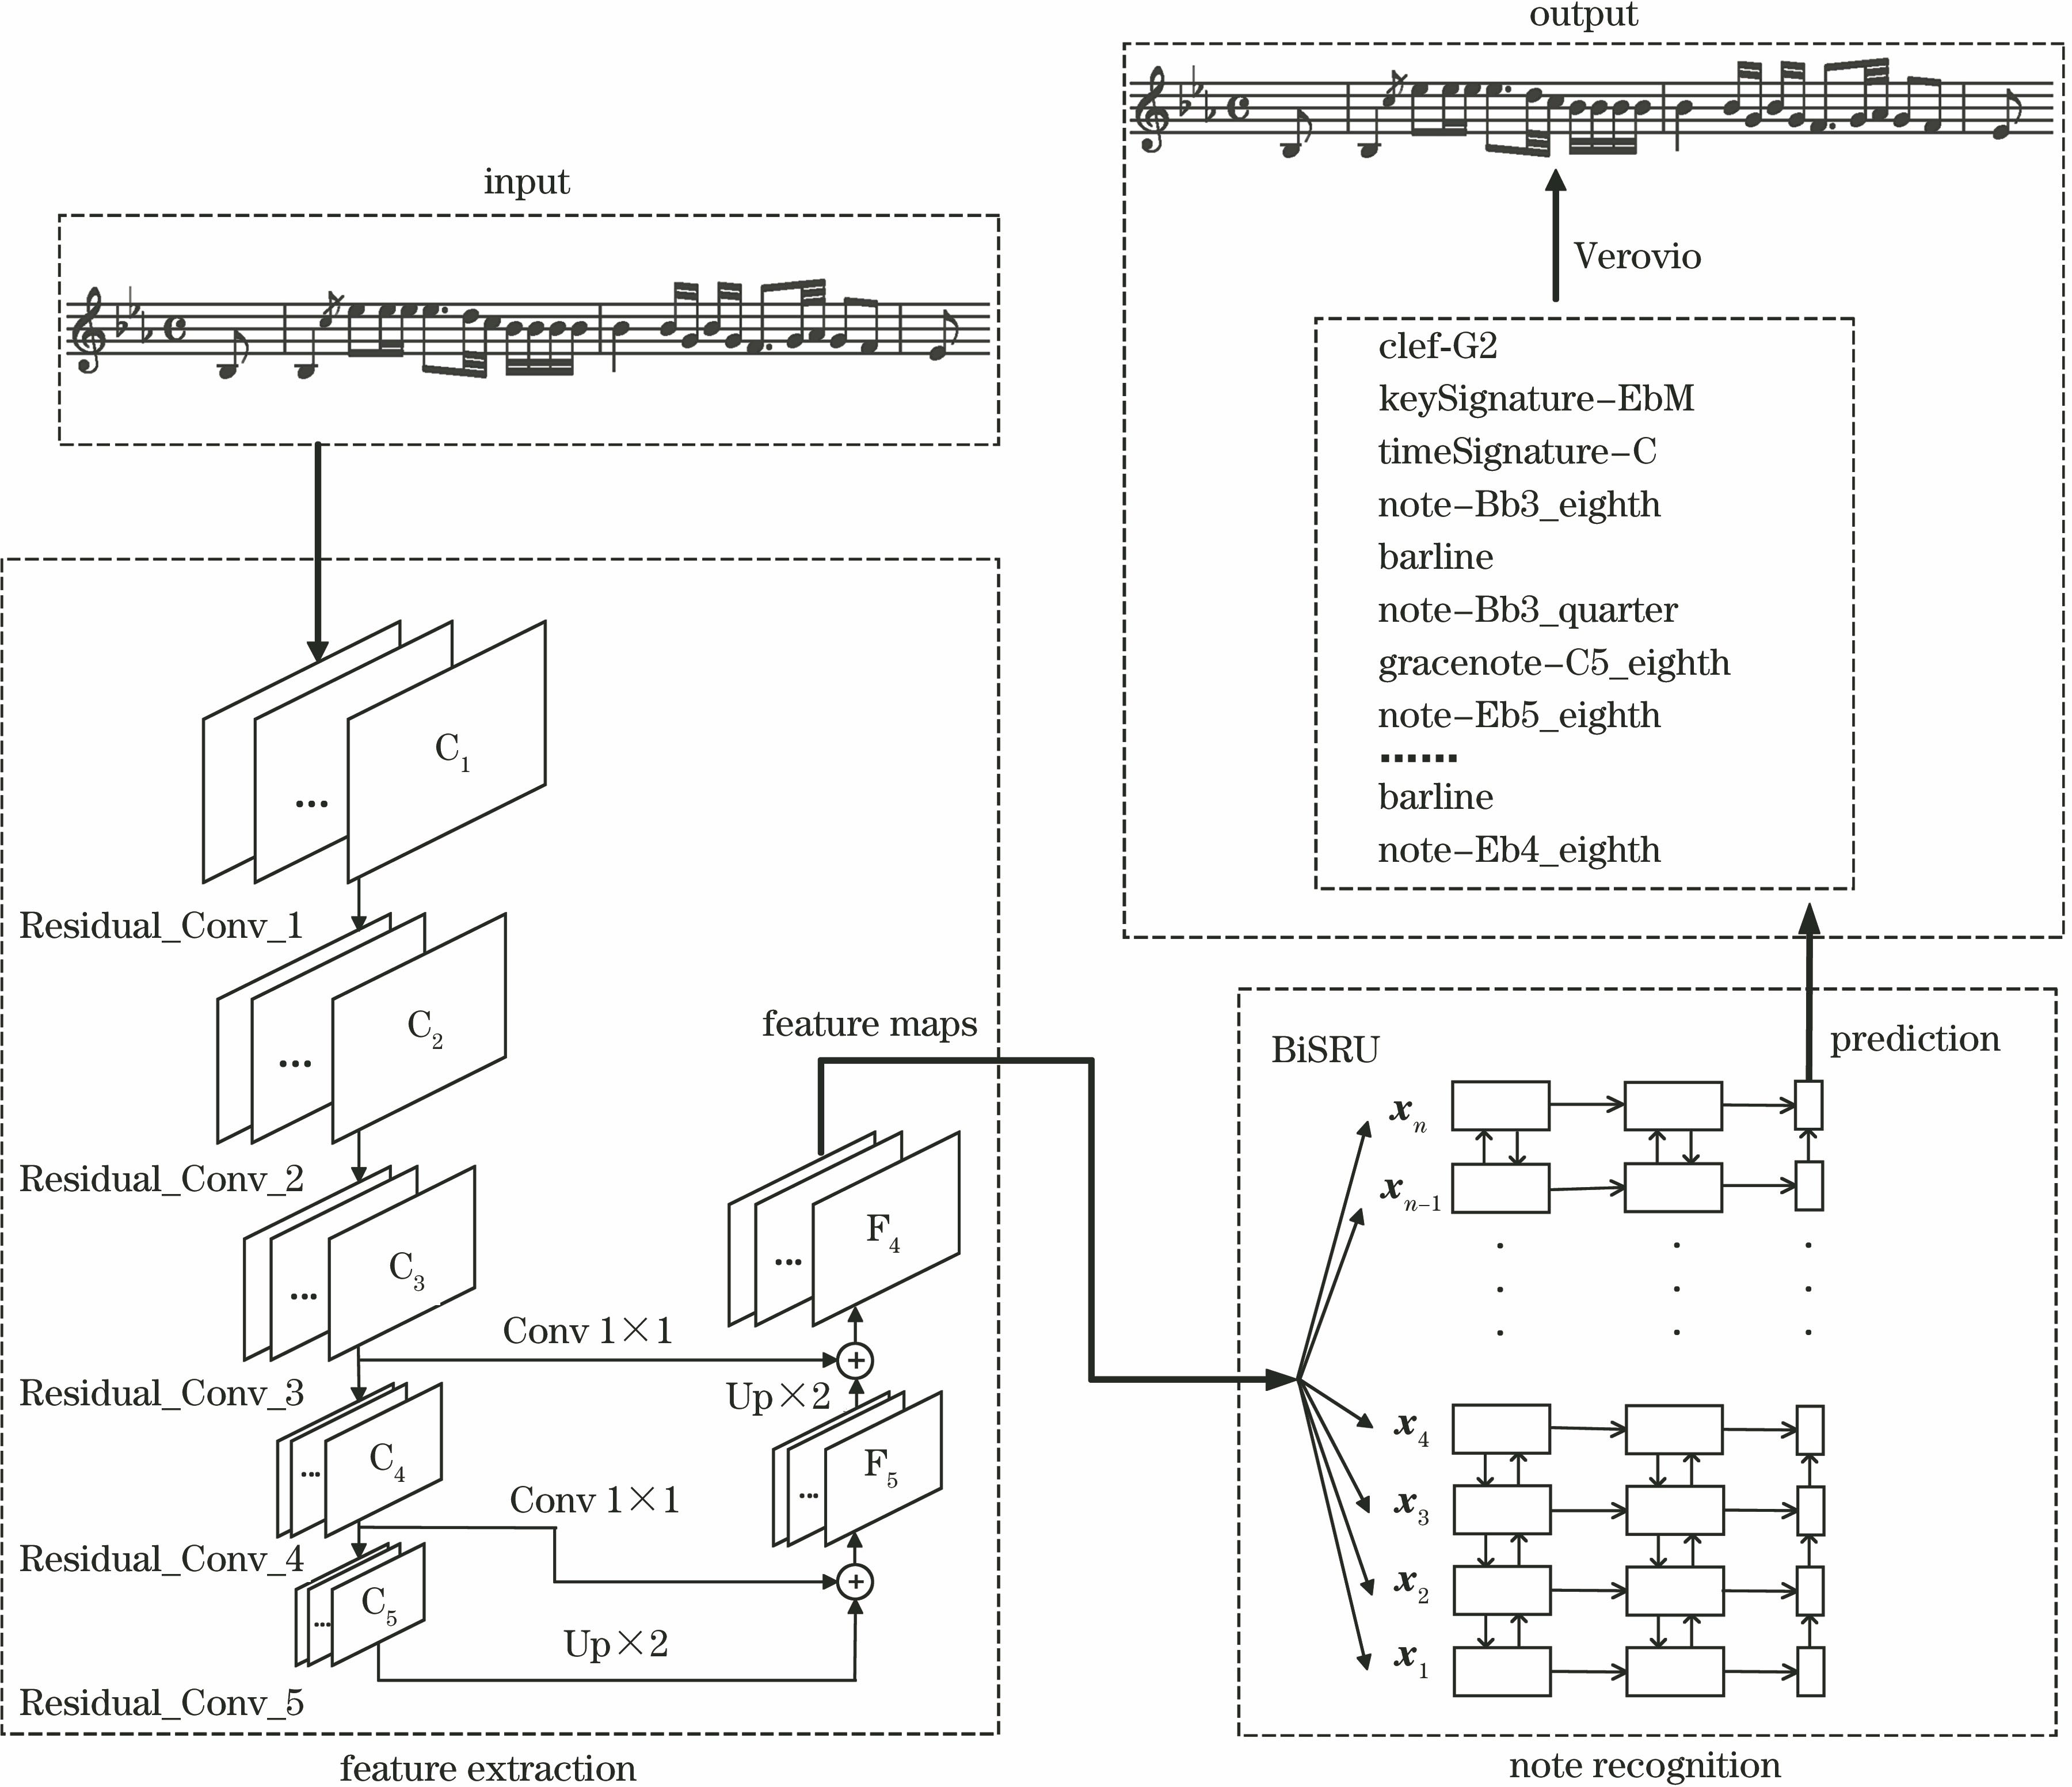
Fig. 1. Schematic diagram of MF-RC-BiSRU
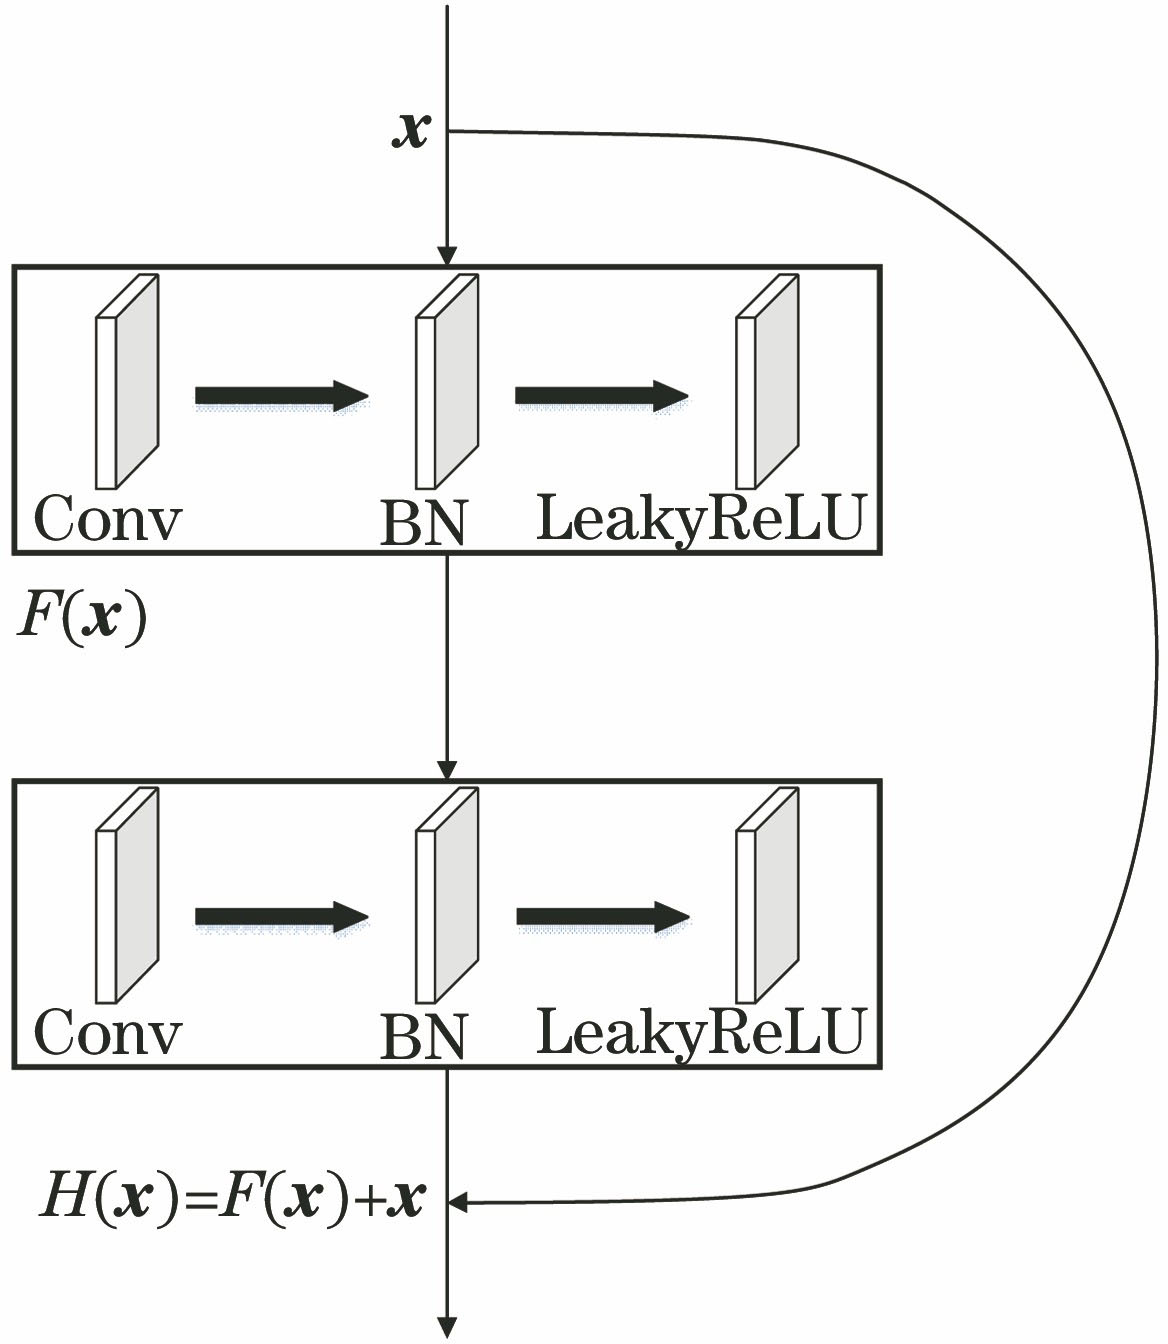
Fig. 2. Schematic diagram of residual structure
Fig. 3. Schematic diagram of multi-scale feature fusion
Fig. 4. Structure of SRU
Fig. 5. Schematic diagram of BiSRU
Fig. 6. Difficulties of note recognition in music score
Fig. 7. Three methods of data processing to simulate unsatisfactory music image. (a) Original incipit; (b) incipit of white Gaussian noise added; (c) incipit of Perlin noise added; (d) incipit of elastic transformations added
Fig. 8. Comparison of training loss and accuracy for C-BiLSTM and RC-BiLSTM networks. (a) Comparison of training loss; (b) comparison of symbol error rate
Fig. 9. Comparison of features in different convolution layers. (a) Original incipit; (b) shallow feature map C1; (c) deeper feature map C3; (d) deepest feature map C5; (e) multi-scale feature fusion map F4
Fig. 10. Comparison of the symbol error rates in the different networks
Fig. 11. Comparison of MF-RC-BiSRU and MF-RC-BiLSTM. (a) Comparison of training loss; (b) comparison of symbol error rates
Fig. 12. Test results of the same incipit in four different networks.(a) Original incipit; (b) C-BiLSTM; (c) RC-BiLSTM; (d) MF-RC-BiLSTM; (e) MF-RC-BiSRU
Fig. 13. Comparison of loss in different methods
| ||||||||||||||||||||||||||||||||||
Table 1. Structure parameters of the improved network
|
Table 2. Comparison of accuracy in different networks
|
Table 3. Performance comparison of different methods


Set citation alerts for the article
Please enter your email address

© Copyright 2018-2021 | Chinese Laser Press. All Rights Reserved 沪ICP备15018463号-20