
Ren-miao PENG, Peng-peng XU, Yi-mo ZHAO, Li-jun BAO, Cheng LI. Identification of Two-Dimensional Material Nanosheets Based on Deep Neural Network and Hyperspectral Microscopy Images[J]. Spectroscopy and Spectral Analysis, 2022, 42(6): 1965
- Spectroscopy and Spectral Analysis
- Vol. 42, Issue 6, 1965 (2022)
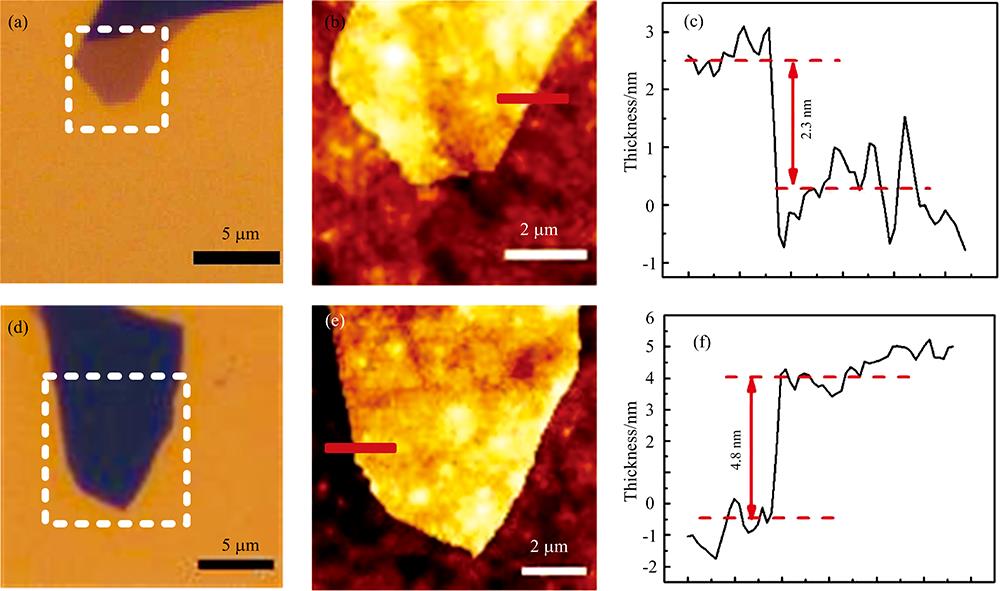
Fig. 1. Characterization of MoS2 sample
(a), (d): MoS2 optical images; (b), (e): AFM images; (c), (f): Thicknesses obtained by AFM analysis
(a), (d): MoS2 optical images; (b), (e): AFM images; (c), (f): Thicknesses obtained by AFM analysis
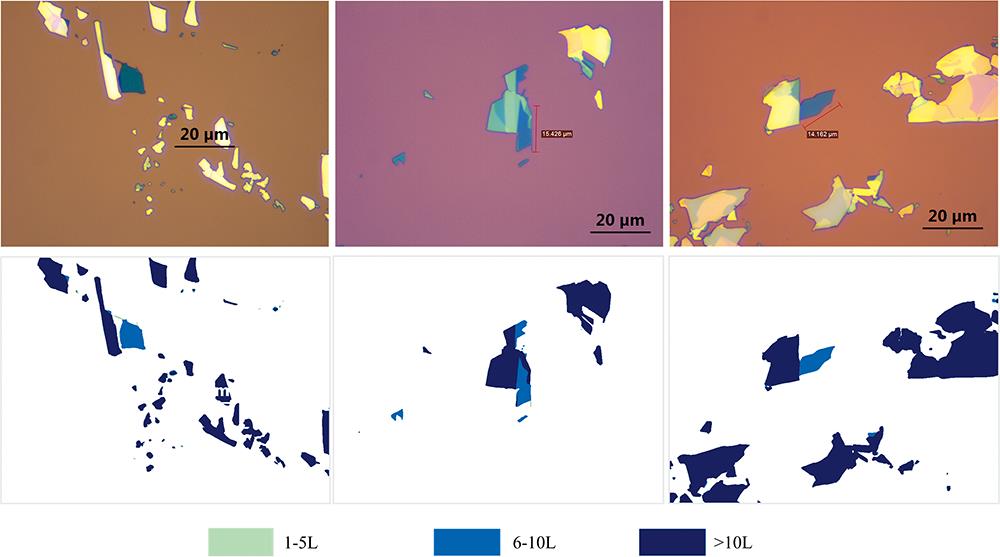
Fig. 2. Partial labels of MoS2 nanosheets marked by different thickness ranges
Fig. 3. Processed optical images and corresponding label images
Fig. 4. Diagram of Network structure
Fig. 5. Structure of residual convolution network
Fig. 6. Structure of pyramid pooling model
Fig. 7. Schematic diagram of low-level feature map reuse
Fig. 8. Loss curve and accuracy curve during 2D-Net network training
Fig. 9. Confusion matrix of test results
Fig. 10. The prediction results of the four network structures
Fig. 11. Output results of feature map visualization
(a): MoS2 optical images and F2 feature maps; (b): MoS2 optical images and F5 feature maps
(a): MoS2 optical images and F2 feature maps; (b): MoS2 optical images and F5 feature maps
Fig. 12. Transfer learning for exfoliated grapheme
(a): Predicted results; (b): Confusion matrix of testing
(a): Predicted results; (b): Confusion matrix of testing
|
Table 1. Network parameters in the encoding and decoding stages
|
Table 2. Test results of four network structures

Set citation alerts for the article
Please enter your email address
© Copyright 2018-2021 | Chinese Laser Press. All Rights Reserved 沪ICP备15018463号-20