
Jiale Gao, Chengang Lü, Hao Qi, Fei Peng. Adaptive Illumination Method for Machine Vision Based on Dual-Frequency Phase Shift Profilometry[J]. Laser & Optoelectronics Progress, 2019, 56(3): 031502
- Laser & Optoelectronics Progress
- Vol. 56, Issue 3, 031502 (2019)
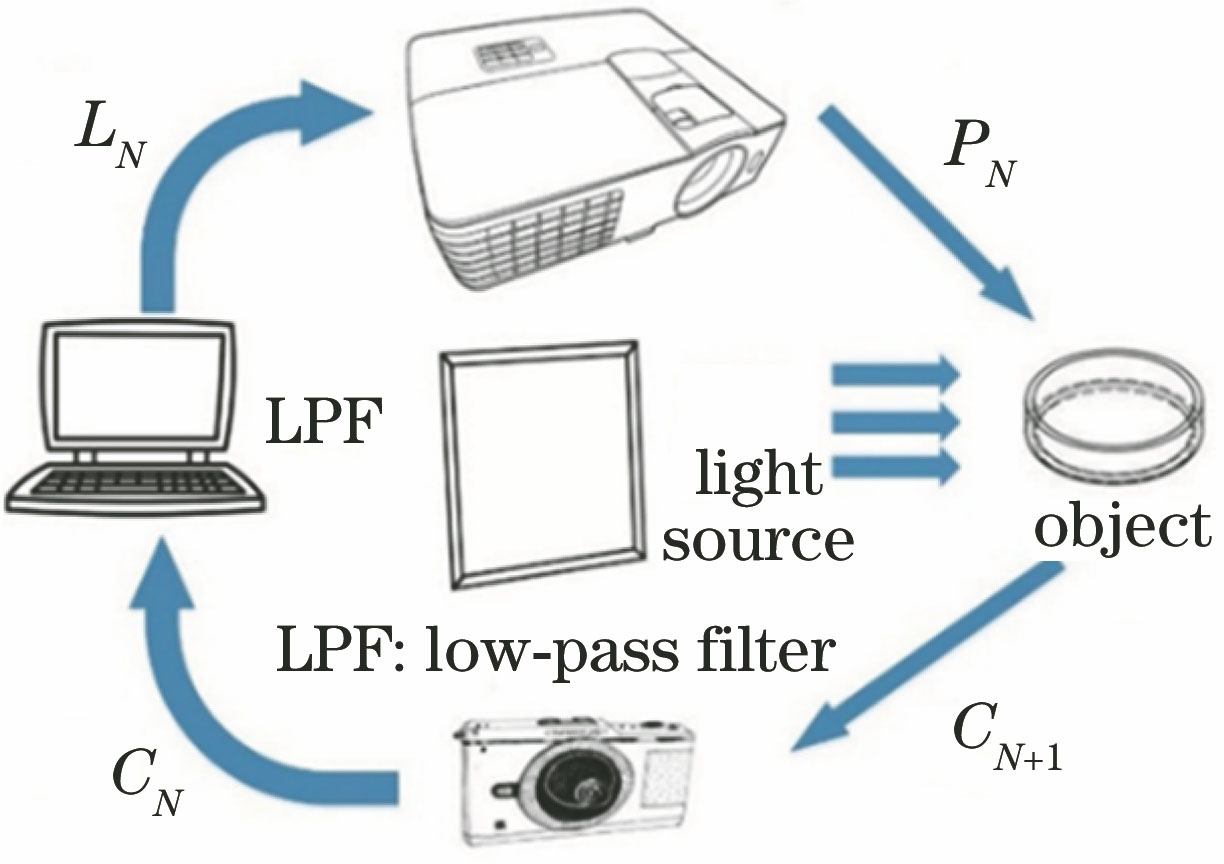
Fig. 1. Schematic of adaptive illumination
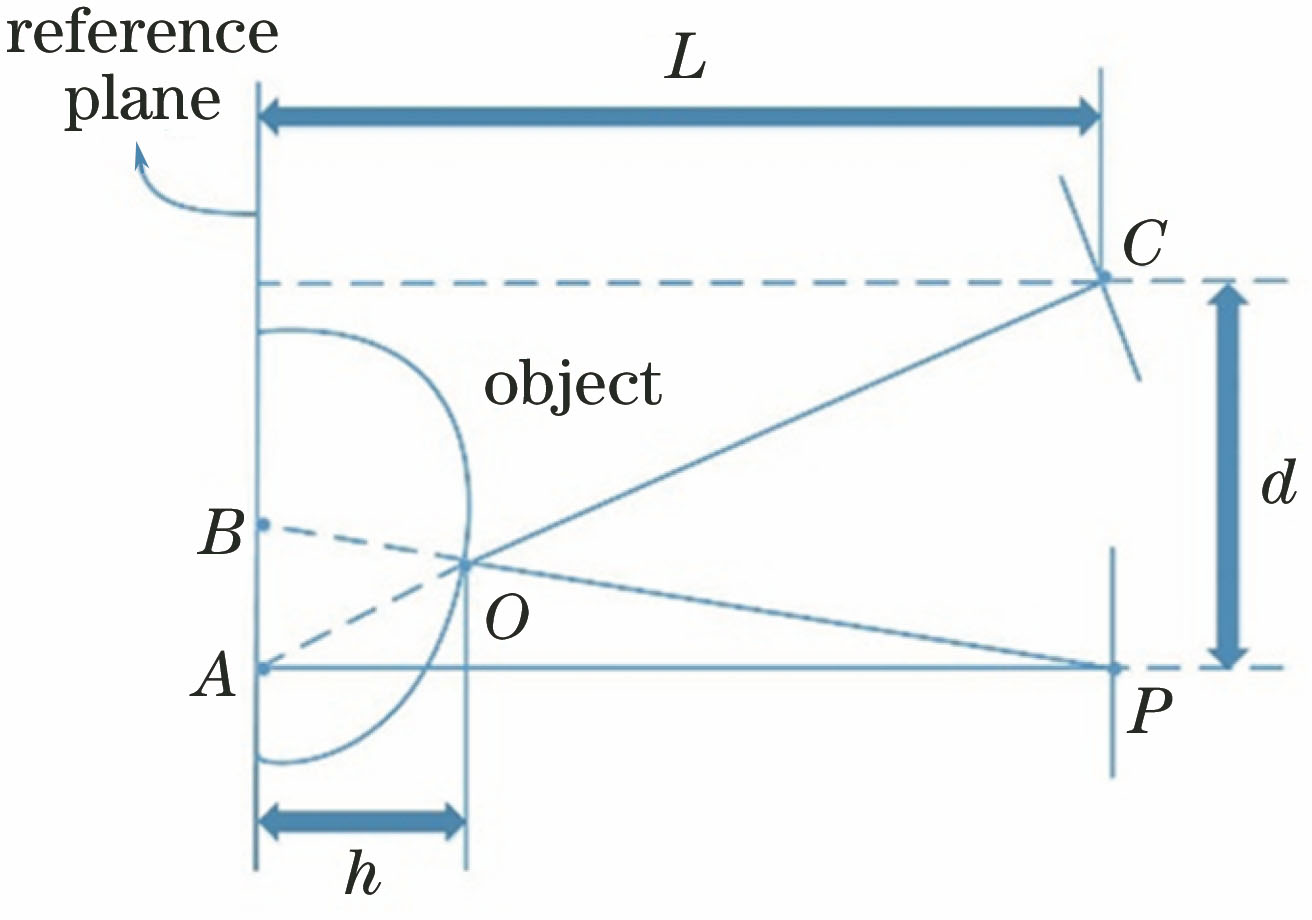
Fig. 2. Basic schematic of depth measurement
Fig. 3. Dual-frequency color four step phase-shifting fringe pattern. The phase shift (a) 0, (b) π/2, (c) π, and (d) 3π/2, respectively
Fig. 4. Wrapped phase and unwrapped phase. (a) Low-frequency wrapped phase; (b) low-frequency unwrapped phase; (c) high-frequency wrapped phase; (d) high-frequency unwrapped phase
Fig. 5. Surface depth map of target object
Fig. 6. Less oversaturation and gray histograms. (a) Illumination distribution map of object surface before adaptive illumination; (b) corresponding gray histogram before adaptive illumination; (c) illumination distribution map of object surface after adaptive illumination; (d) corresponding gray histogram after adaptive illumination
Fig. 7. Severe oversaturation and gray histograms. (a)(e) Illumination distribution map of object surface before adaptive illumination; (b)(f) corresponding gray histogram before adaptive illumination; (c)(g)illumination distribution map of object surface after adaptive illumination; (d)(h) corresponding gray histogram after adaptive illumination
Fig. 8. Weak light condition and gray histograms. (a) Illumination distribution map of object surface before adaptive illumination; (b) corresponding gray histogram before adaptive illumination; (c) illumination distribution map of object surface after adaptive illumination; (d) corresponding gray histogram after adaptive illumination
Fig. 9. Contrast evaluation
Fig. 10. Entropy function evaluation
|
Table 1. Experiment equipment

Set citation alerts for the article
Please enter your email address
© Copyright 2018-2021 | Chinese Laser Press. All Rights Reserved 沪ICP备15018463号-20