
Jiaqi Lü, Xiping Xu, Ning Zhang, Peng Yin, Hengyi Zhang. Design of Natural Optical Fiber Illumination System Based on Lightguide Plate Concentrator[J]. Acta Optica Sinica, 2020, 40(14): 1422001
- Acta Optica Sinica
- Vol. 40, Issue 14, 1422001 (2020)
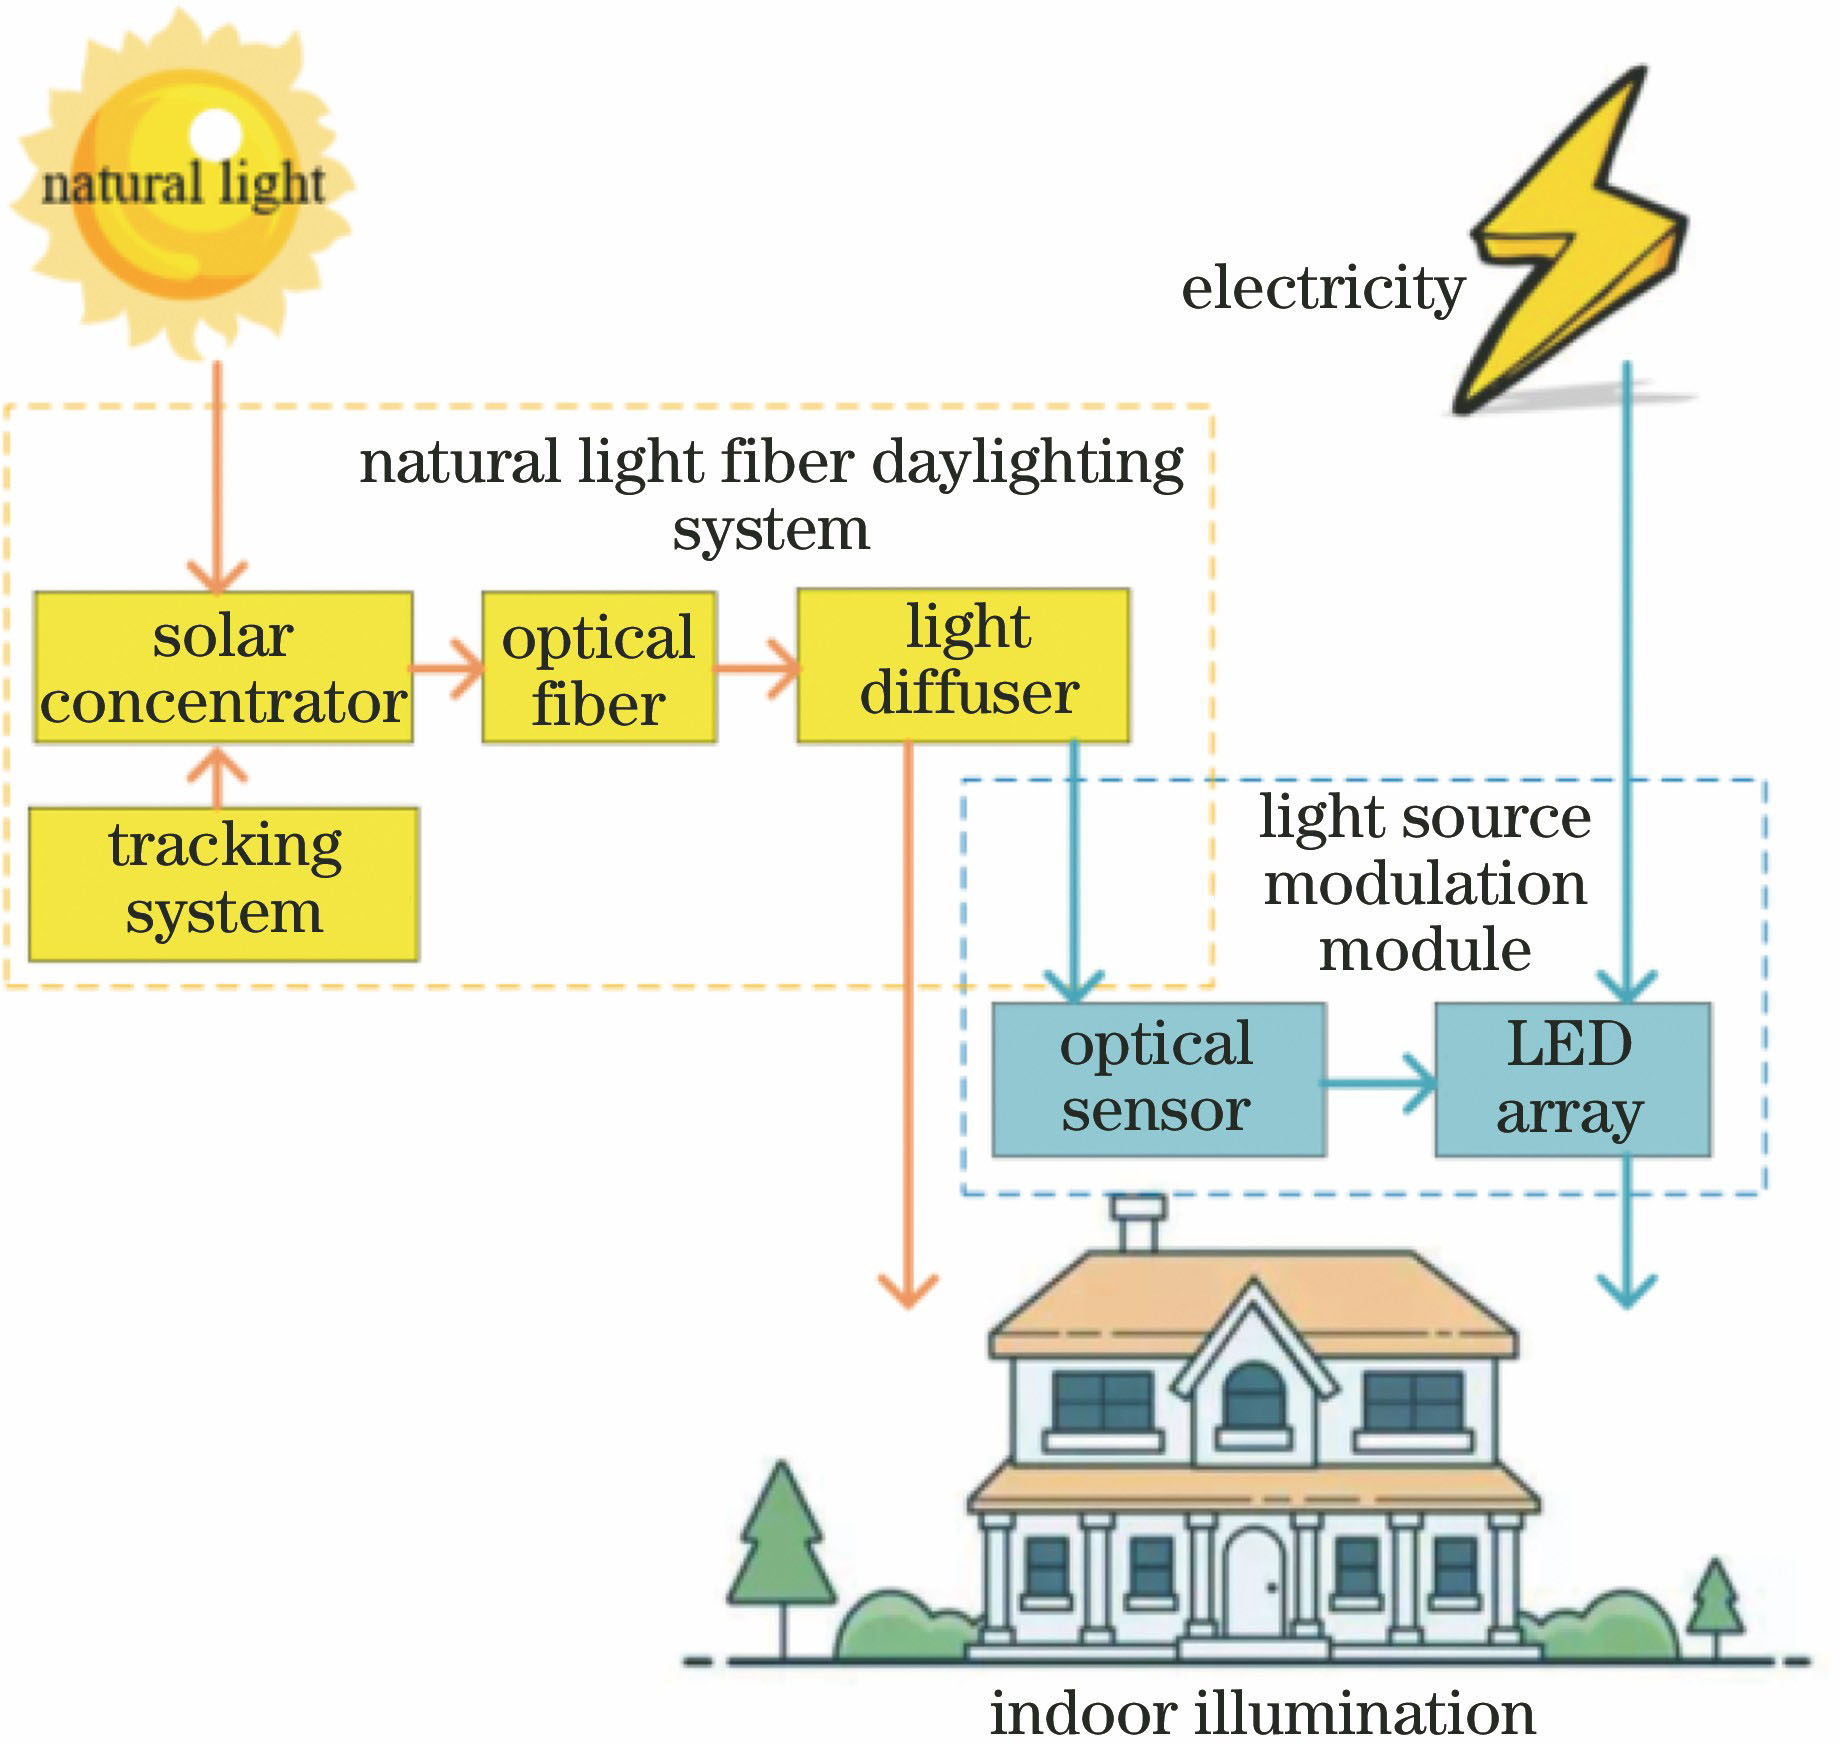
Fig. 1. Structure of indoor natural light illumination system
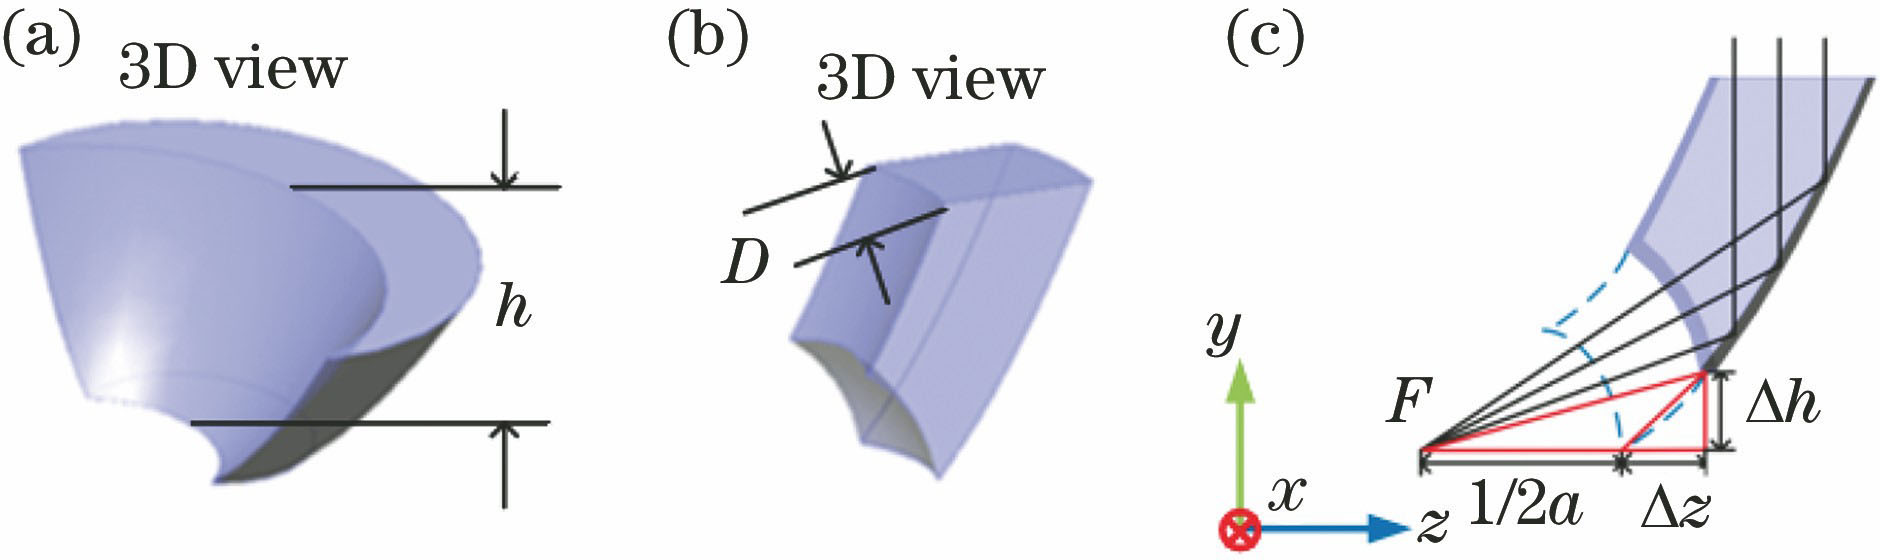
Fig. 2. Clipping process of light collection module. (a) Double paraboloid structure; (b) structure is obtained by removing outer edge of double paraboloid structure and spherical part from lower surface; (c) height change of light collection module
Fig. 3. Other optical elements in the system. (a) Visible light are transmitted and invisible light are reflected to photovoltaic cell by PBS; (b) five LEDs are bonded with lightguide plate entrance; (c) fiber beam are coupled into lightguide plate exit; (d) light emitted from LED converge through CPC
Fig. 4. Overall structure of natural light illumination system
Fig. 5. Changes of luminous flux. (a) Effect of different times and lightguide plate thickness on indoor luminous flux; (b) luminous flux provided by sunlight and LED light source and received total luminous flux
Fig. 6. Effect of different parameters on optical concentration ratio. (a) Light collection module width; (b) parabolic coefficient
Fig. 7. Effect of light collection module width and parabolic coefficient on optical concentration ratio
Fig. 8. Effect of height of light collection module on optical concentration ratio and CAP value when coupling structure radius are different. (a) 0.1 mm; (b) 0.2 mm; (c) 0.5 mm
Fig. 9.
Test system of concentrator
Fig. 10. Effect of number of light collection modules on geometrical concentration ratio and optical efficiency
Fig. 11. Fiber output illuminance and solar irradiance versus time in different weather conditions. (a) Calm weather; (b) cloudy weather
|
Table 1. Solar illuminance and calculated indoor luminous flux at different times

Set citation alerts for the article
Please enter your email address
© Copyright 2018-2021 | Chinese Laser Press. All Rights Reserved 沪ICP备15018463号-20