
Shuang Luo, Hui Huang, Kaibing Zhang. Boosting Regression-Based Single-Image Super-Resolution Reconstruction[J]. Laser & Optoelectronics Progress, 2022, 59(8): 0810018
- Laser & Optoelectronics Progress
- Vol. 59, Issue 8, 0810018 (2022)
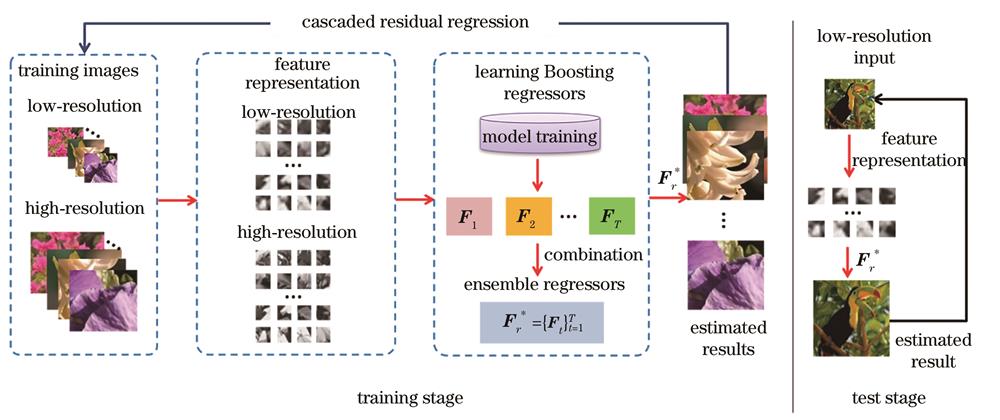
Fig. 1. Framework of the proposed method
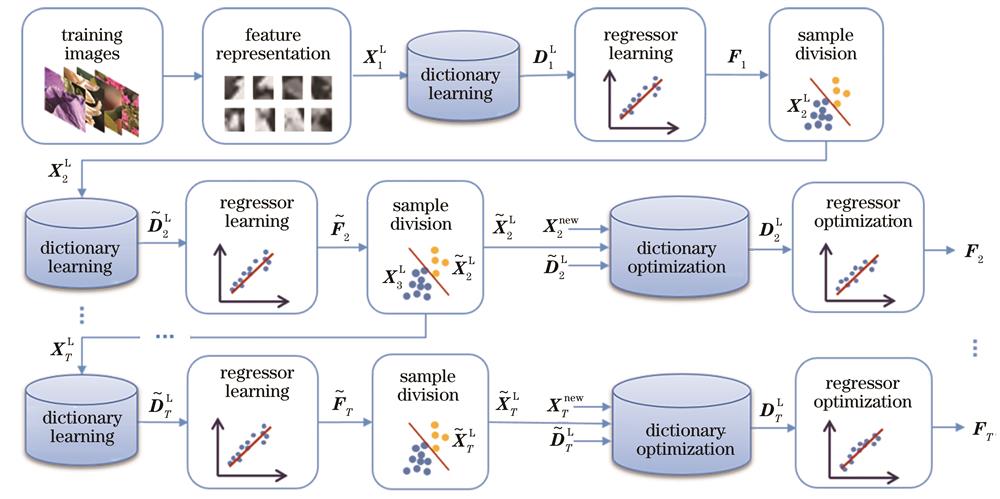
Fig. 2. Block diagram of Boosting regressor learning algorithm
Fig. 3. Block diagram of refinement stage
Fig. 4. Performance comparison of different super-resolution methods on Set5 dataset for ×3 magnification
Fig. 5. Super-resolution results of “Flower” in Set10 dataset for ×3 magnification. (a) Original image; (b) A+ method; (c) SRCNN method; (d) Zhang's method; (e) MMPM method; (f) Ours
Fig. 6. Super-resolution results of “Img092” in Urban100 dataset for ×3 magnification. (a) Original image; (b) A+ method; (c) SRCNN method; (d) Zhang's method; (e) MMPM method; (f) Ours
Fig. 7. Super-resolution results on real-world dataset for ×3 magnification. (a) A+ method; (b) SRCNN method; (c) Zhang's method; (d) MMPM method; (e) Ours
Fig. 8. Influence of parameter T on the average PSNR in B100 dataset
Fig. 9. Influence of parameter T on the average PSNR in Set10 dataset
Fig. 10. Influence of sub-dictionary size on the reconstruction results in Set5 dataset. (a) Average PSNR value varing with sub-dictionary size; (b) average SSIM value varing with sub-dictionary size
|
Table 1. Average PSNR and SSIM values of different methods for ×2 magnification
|
Table 2. Average PSNR and SSIM values of different methods for ×3 magnification
| ||||||||||||||||||||||||||||||||||||||||||||||||||||||
Table 3. Performance evaluation on five benchmarks by using different cascaded times

Set citation alerts for the article
Please enter your email address
© Copyright 2018-2021 | Chinese Laser Press. All Rights Reserved 沪ICP备15018463号-20