Author Affiliations
School of Information & Computer, Anhui Agricultural University, Hefei, Anhui 230036, Chinashow less
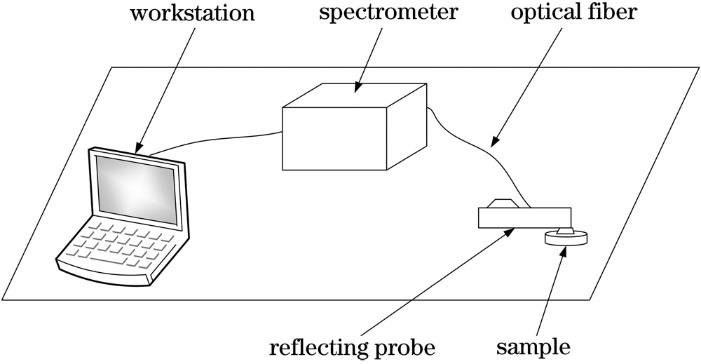
Fig. 1. Indoor spectrum acquisition system
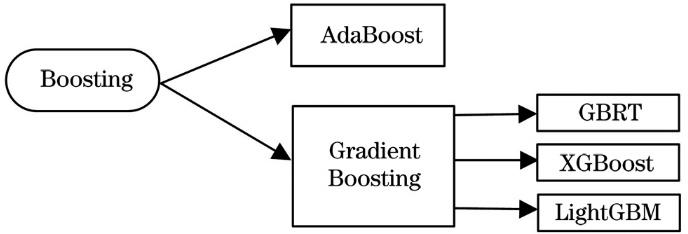
Fig. 2. Boosting algorithm classification
Fig. 3. Schematic of AdaBoost regression
Fig. 4. Technical route analysis of near-infrared hyperspectral characteristics of available nitrogen in soil
Fig. 5. Contrast of spectra before and after preprocess. (a) Original spectra; (b) SG; (c) LG; (d) FD; (e) SNV; (f) SG+SNV; (g) SG+LG; (h) SG+FD
Fig. 6. R2 and RPD values of regression models with testing obtained by different pretreatment methods. (a) R2; (b) RPD
Fig. 7. R2, RMSE, and RPD values of the testing sets of different algorithms. (a) R2;(b) RMSE; (c) RPD
Fig. 8. Optimal combination of wavelength points selected by different algorithms
Fig. 9. Measured and predicted values of PSO-AdaBoost model based on SNV in prediction set
| Dataset | Number of samples | Max /(mg·kg-1) | Min /(mg·kg-1) | Median /(mg·kg-1) | Mean /(mg·kg-1) | Standard /(mg·kg-1) |
|---|
| Total set | 188 | 731.584 | 19.32 | 132.644 | 179.083 | 144.398 | | Training set | 131 | 731.584 | 19.32 | 130.732 | 179.440 | 148.217 | | Testing set | 57 | 687.148 | 67.62 | 137.816 | 178.255 | 135.211 |
|
Table 1. Statistical parameters of soil available nitrogen content
| Preprocess method | Regression model | Training set | Testing set | Parameter |
|---|
| R2 | RPD | R2 | RPD | Number of latent variables |
|---|
| SG | PLSR | 0.92 | 3.62 | 0.894 | 3.08 | 16 | | LG | PLSR | 0.94 | 4.02 | 0.898 | 3.14 | 11 | | FD | PLSR | 0.95 | 4.39 | 0.718 | 1.88 | 6 | | SNV | PLSR | 0.96 | 4.87 | 0.857 | 2.64 | 11 | | SG+SNV | PLSR | 0.94 | 4.16 | 0.845 | 2.54 | 11 | | SG+LG | PLSR | 0.95 | 4.25 | 0.916 | 3.45 | 14 | | SG+FD | PLSR | 0.88 | 2.87 | 0.738 | 1.95 | 6 | | Preprocess method | Regression model | Training set | Testing set | Parameter | | R2 | RPD | R2 | RPD | Learning rate/number of estimators | | SG | GBRT | 0.99 | 28.27 | 0.610 | 1.60 | 0.4/400 | | LG | GBRT | 0.99 | 28.27 | 0.508 | 1.43 | 0.2/200 | | FD | GBRT | 0.99 | 28.27 | 0.668 | 1.73 | 0.4/200 | | Preprocess method | Regression model | Training set | Testing set | Parameter | | R2 | RPD | R2 | RPD | Learning rate/number of estimators | | SNV | GBRT | 0.99 | 34.96 | 0.915 | 3.43 | 0.2/100 | | SG+SNV | GBRT | 0.99 | 15.13 | 0.910 | 3.33 | 0.4/100 | | SG+LG | GBRT | 0.99 | 28.27 | 0.573 | 1.53 | 0.4/100 | | SG+FD | GBRT | 0.99 | 22.27 | 0.898 | 3.14 | 0.1/300 | | SG | AdaBoost | 0.97 | 5.43 | 0.644 | 1.68 | 0.4/100 | | LG | AdaBoost | 0.95 | 4.68 | 0.576 | 1.54 | 0.4/200 | | FD | AdaBoost | 0.99 | 23.74 | 0.573 | 1.53 | 0.1/200 | | SNV | AdaBoost | 0.99 | 12.14 | 0.921 | 3.43 | 0.2/100 | | SG+SNV | AdaBoost | 0.99 | 20.07 | 0.912 | 3.37 | 0.1/200 | | SG+LG | AdaBoost | 0.96 | 4.75 | 0.319 | 1.21 | 0.3/200 | | SG+FD | AdaBoost | 0.99 | 28.27 | 0.876 | 2.84 | 0.1/200 | | SG | XGBoost | 0.99 | 28.24 | 0.745 | 1.98 | 0.1/300 | | LG | XGBoost | 0.99 | 28.24 | 0.739 | 1.95 | 0.1/300 | | FD | XGBoost | 0.99 | 28.26 | 0.470 | 1.15 | 0.2/100 | | SNV | XGBoost | 0.99 | 28.21 | 0.912 | 3.37 | 0.4/100 | | SG+SNV | XGBoost | 0.99 | 25.26 | 0.908 | 3.31 | 0.2/100 | | SG+LG | XGBoost | 0.99 | 28.25 | 0.745 | 1.98 | 0.1/300 | | SG+FD | XGBoost | 0.99 | 28.26 | 0.835 | 2.46 | 0.4/100 | | SG | LightGBM | 0.79 | 2.21 | | 0.81 | 0.1/400 | | LG | LightGBM | 0.75 | 1.99 | | 0.69 | 0.4/400 | | FD | LightGBM | 0.99 | 19.60 | 0.521 | 1.44 | 0.4/200 | | SNV | LightGBM | 0.99 | 26.87 | 0.849 | 2.57 | 0.4/100 | | SG+SNV | LightGBM | 0.99 | 25.44 | 0.857 | 2.65 | 0.4/100 | | SG+LG | LightGBM | 0.79 | 2.19 | | 0.68 | 0.3/400 | | SG+FD | LightGBM | 0.99 | 22.62 | 0.695 | 1.81 | 0.1/200 |
|
Table 2. Influence of different pretreatment methods on regression model
| Preprocess method | Algorithm | Wavelength range /nm | Number of variables | Training set | Testing set | Parameter |
|---|
| R2 | RPD | R2 | RPD | Learning rate/number of estimators |
|---|
| SNV | AdaBoost | 350--1655 | 1305 | 0.99 | 12.14 | 0.921 | 3.43 | 0.2/100 | | SNV | GBRT | 350--1655 | 1305 | 0.99 | 34.96 | 0.915 | 3.43 | 0.2/100 | | SNV | XGBoost | 350--1655 | 1305 | 0.99 | 28.21 | 0.912 | 3.37 | 0.4/100 | | SNV | RF-GBRT | 600--999 | 200 | 0.99 | 28.27 | 0.922 | 3.57 | 0.4/300 | | SNV | PSO-GBRT | 602--999 | 202 | 0.99 | 28.27 | 0.924 | 3.63 | 0.2/400 | | SNV | GA-GBRT | 600--999 | 184 | 0.99 | 28.27 | 0.932 | 3.83 | 0.4/300 | | SNV | SA-GBRT | 602--998 | 206 | 0.99 | 28.27 | 0.941 | 4.11 | 0.4/300 | | SNV | GGA-GBRT | 601--999 | 202 | 0.99 | 28.27 | 0.919 | 3.52 | 0.2/400 | | SNV | RF-AdaBoost | 600--999 | 200 | 0.99 | 21.24 | 0.939 | 4.06 | 0.2/100 | | SNV | PSO-AdaBoost | 602--999 | 202 | 0.99 | 18.17 | 0.944 | 4.24 | 0.1/100 | | SNV | GA- AdaBoost | 600--999 | 184 | 0.99 | 12.95 | 0.940 | 4.09 | 0.4/100 | | SNV | SA-AdaBoost | 602--998 | 206 | 0.99 | 24.03 | 0.937 | 3.96 | 0.2/100 | | SNV | GGA-AdaBoost | 601--999 | 202 | 0.99 | 24.21 | 0.943 | 4.20 | 0.4/100 | | SNV | RF-XGBoost | 600--999 | 200 | 0.99 | 28.17 | 0.929 | 3.76 | 0.2/100 | | SNV | PSO-XGBoost | 602--999 | 202 | 0.99 | 28.25 | 0.821 | 3.36 | 0.2/400 | | SNV | GA-XGBoost | 600--999 | 184 | 0.99 | 28.22 | 0.886 | 2.96 | 0.3/100 | | SNV | SA-XGBoost | 602--998 | 206 | 0.99 | 20.21 | 0.834 | 2.46 | 0.1/200 | | SNV | GGA-XGBoost | 601--999 | 202 | 0.99 | 27.96 | 0.871 | 2.78 | 0.1/200 | | SG+SNV | AdaBoost | 350--1655 | 1305 | 0.99 | 20.07 | 0.912 | 3.37 | 0.1/200 | | SG+SNV | GBRT | 350--1655 | 1305 | 0.99 | 15.13 | 0.910 | 3.33 | 0.4/100 | | SG+SNV | XGBoost | 350--1655 | 1305 | 0.99 | 25.26 | 0.908 | 3.31 | 0.2/100 | | SG+SNV | RF-GBRT | 603--999 | 202 | 0.99 | 28.27 | 0.919 | 3.53 | 0.2/200 | | SG+SNV | PSO-GBRT | 607--999 | 201 | 0.99 | 28.27 | 0.913 | 3.39 | 0.1/300 | | SG+SNV | GA-GBRT | 604--999 | 209 | 0.99 | 28.27 | 0.927 | 3.69 | 0.4/100 | | Preprocess method | Algorithm | Wavelength range /nm | Number of variables | Training set | Testing set | Parameter | | R2 | RPD | R2 | RPD | Learning rate/number of estimators | | SG+SNV | SA-GBRT | 607--998 | 206 | 0.99 | 28.27 | 0.926 | 3.68 | 0.4/200 | | SG+SNV | GGA-GBRT | 607--999 | 200 | 0.99 | 28.27 | 0.900 | 3.17 | 0.3/400 | | SG+SNV | RF-AdaBoost | 603--999 | 202 | 0.99 | 12.12 | 0.919 | 3.51 | 0.3/100 | | SG+SNV | PSO-AdaBoost | 607--999 | 201 | 0.99 | 15.41 | 0.915 | 3.43 | 0.4/100 | | SG+SNV | GA-AdaBoost | 604--999 | 209 | 0.99 | 24.16 | 0.922 | 3.59 | 0.2/100 | | SG+SNV | SA-AdaBoost | 607--998 | 206 | 0.99 | 20.24 | 0.929 | 3.76 | 0.1/100 | | SG+SNV | GGA-AdaBoost | 607--999 | 200 | 0.99 | 12.45 | 0.924 | 3.64 | 0.3/300 | | SG+SNV | RF-XGBoost | 600--999 | 200 | 0.99 | 28.18 | 0.898 | 3.14 | 0.4/200 | | SG+SNV | PSO-XGBoost | 602--999 | 202 | 0.99 | 27.45 | 0.888 | 2.99 | 0.4/100 | | SG+SNV | GA-XGBoost | 600--999 | 184 | 0.99 | 24.22 | 0.885 | 2.95 | 0.3/100 | | SG+SNV | SA-XGBoost | 602--998 | 206 | 0.99 | 27.31 | 0.883 | 2.92 | 0.4/100 | | SG+SNV | GGA-XGBoost | 601--999 | 202 | 0.99 | 24.84 | 0.882 | 2.91 | 0.3/100 |
|
Table 3. Analysis results of quantitative models with different variables based on the spectral data processed by SNV and SG+SNV