
Mei Yang, Zefu Tan, Li Cai, Xue Yao. Illumination Compensation for Face Images Based on Anisotropic Retinex[J]. Laser & Optoelectronics Progress, 2018, 55(12): 121007
- Laser & Optoelectronics Progress
- Vol. 55, Issue 12, 121007 (2018)
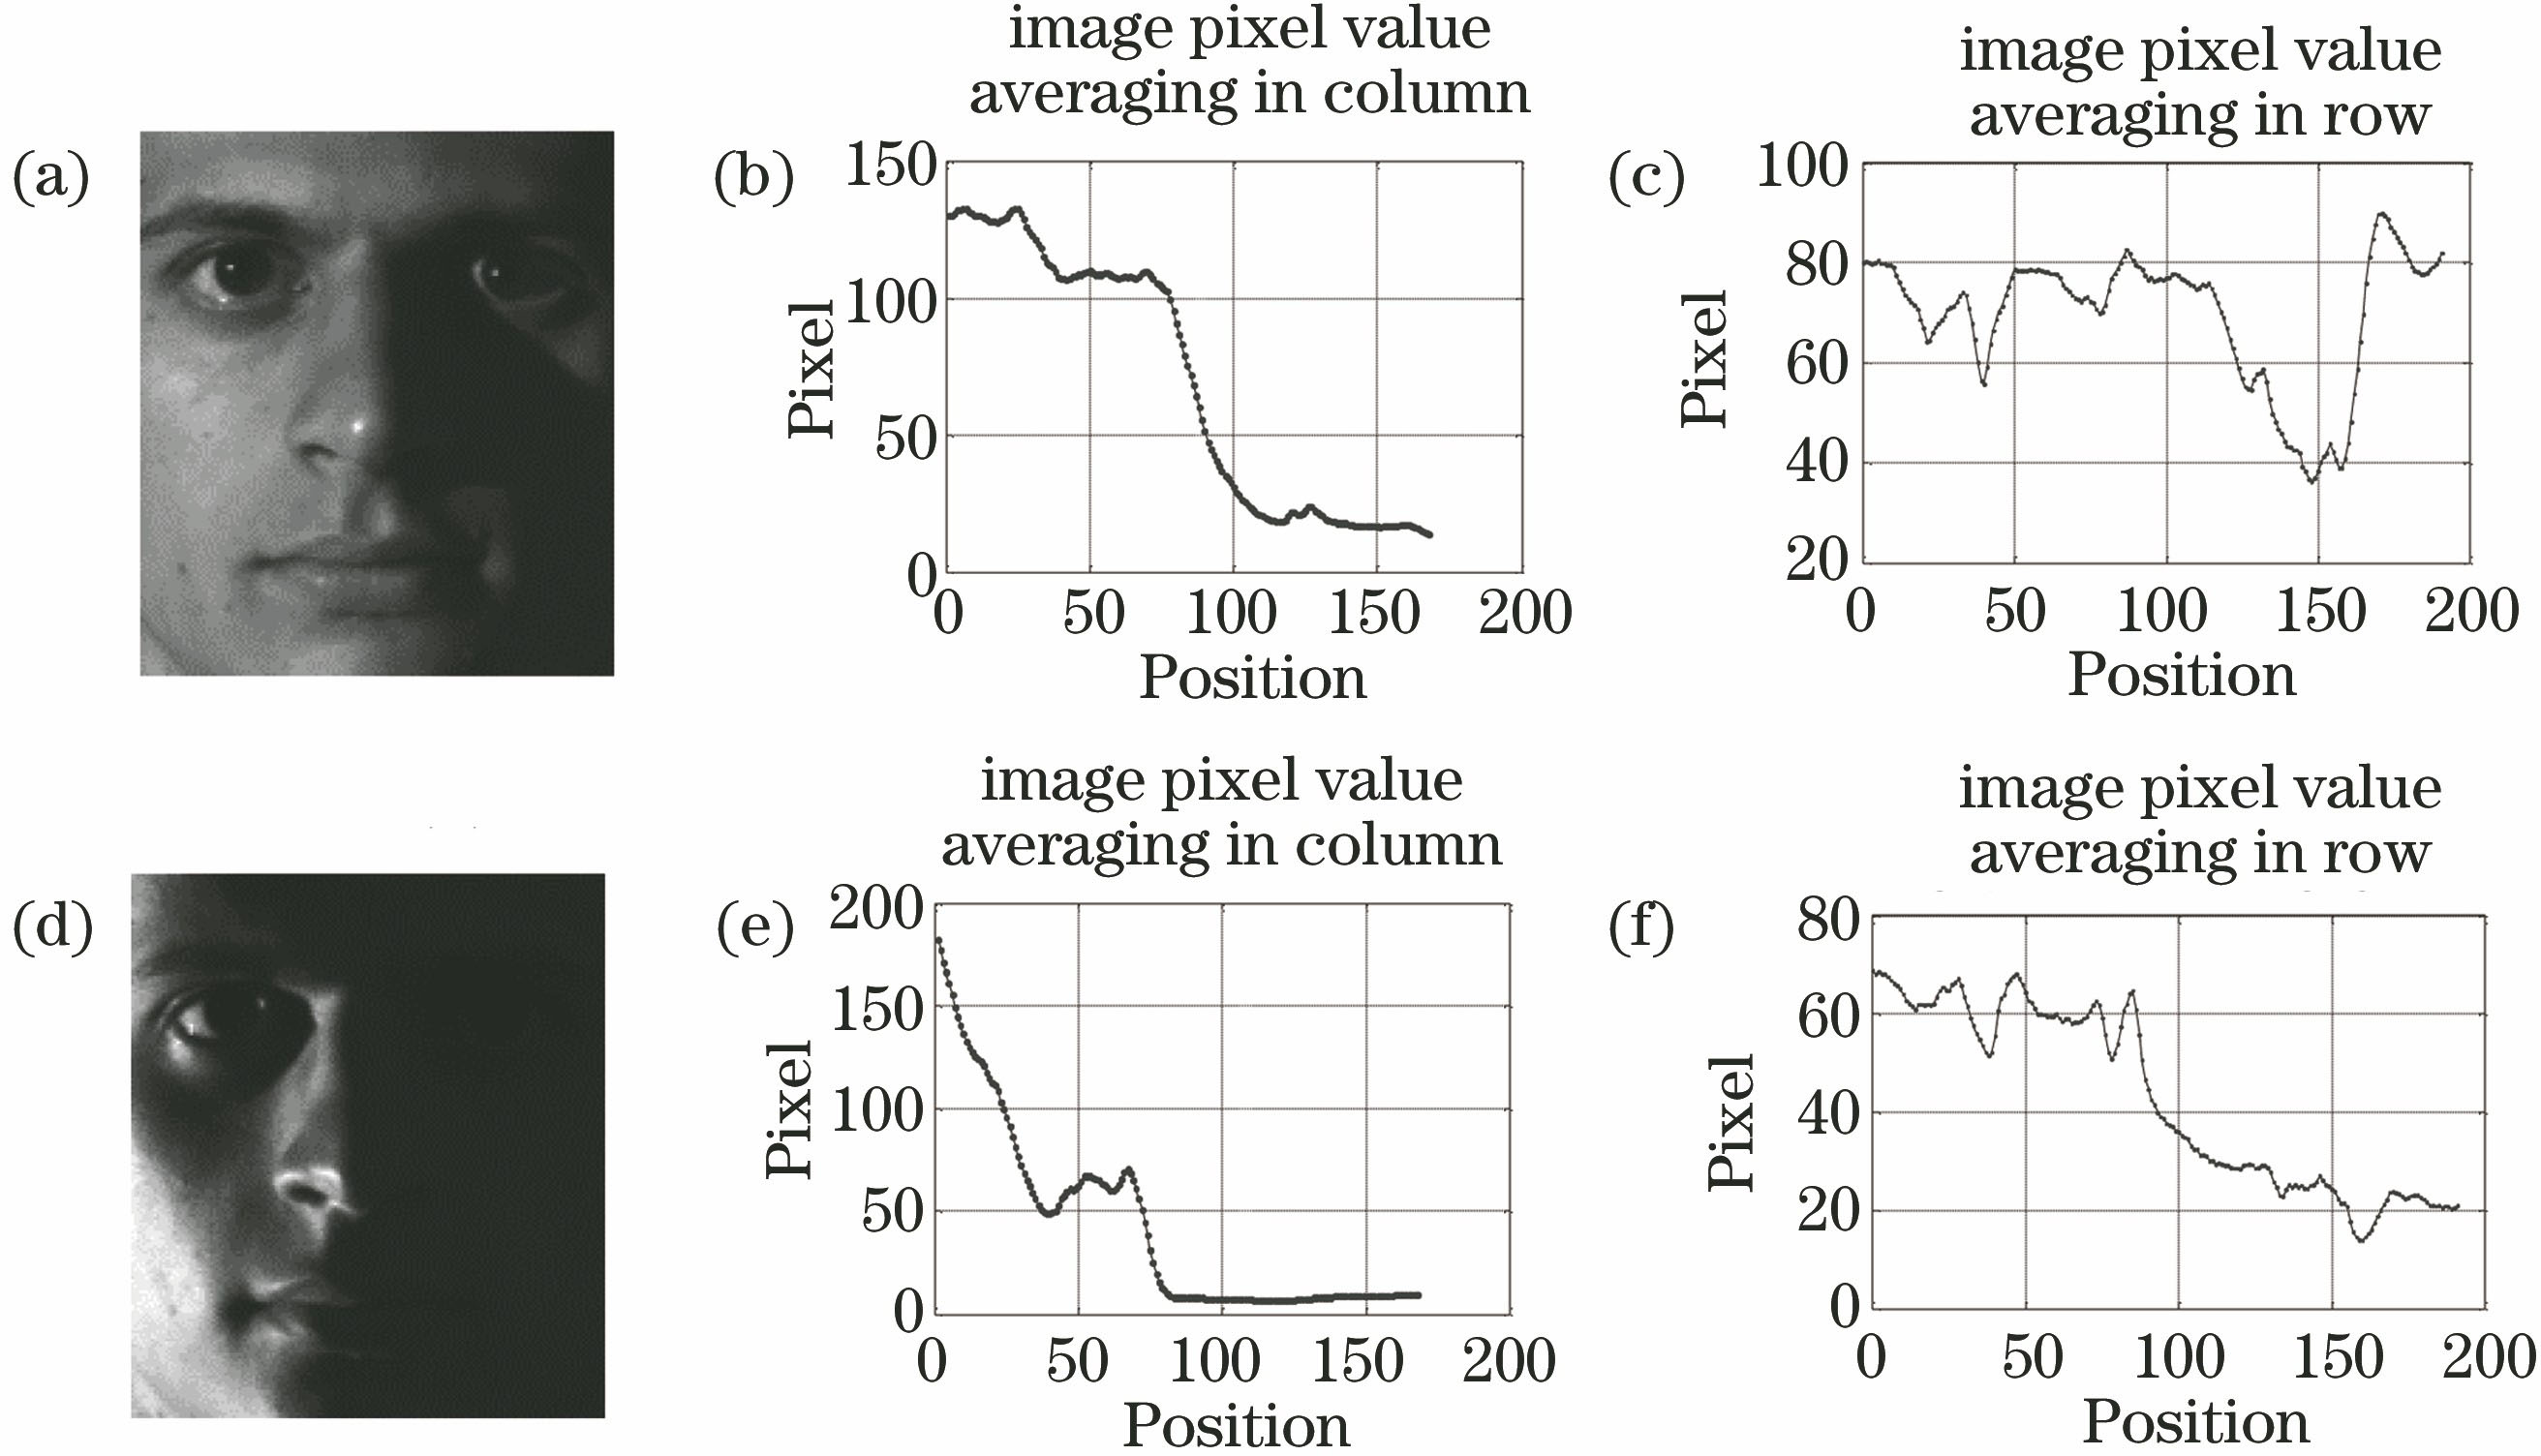
Fig. 1. Pixel mean of image row and column. (a)(d) Original image; (b)(e) pixel mean in column; (c)(f) pixel mean in row
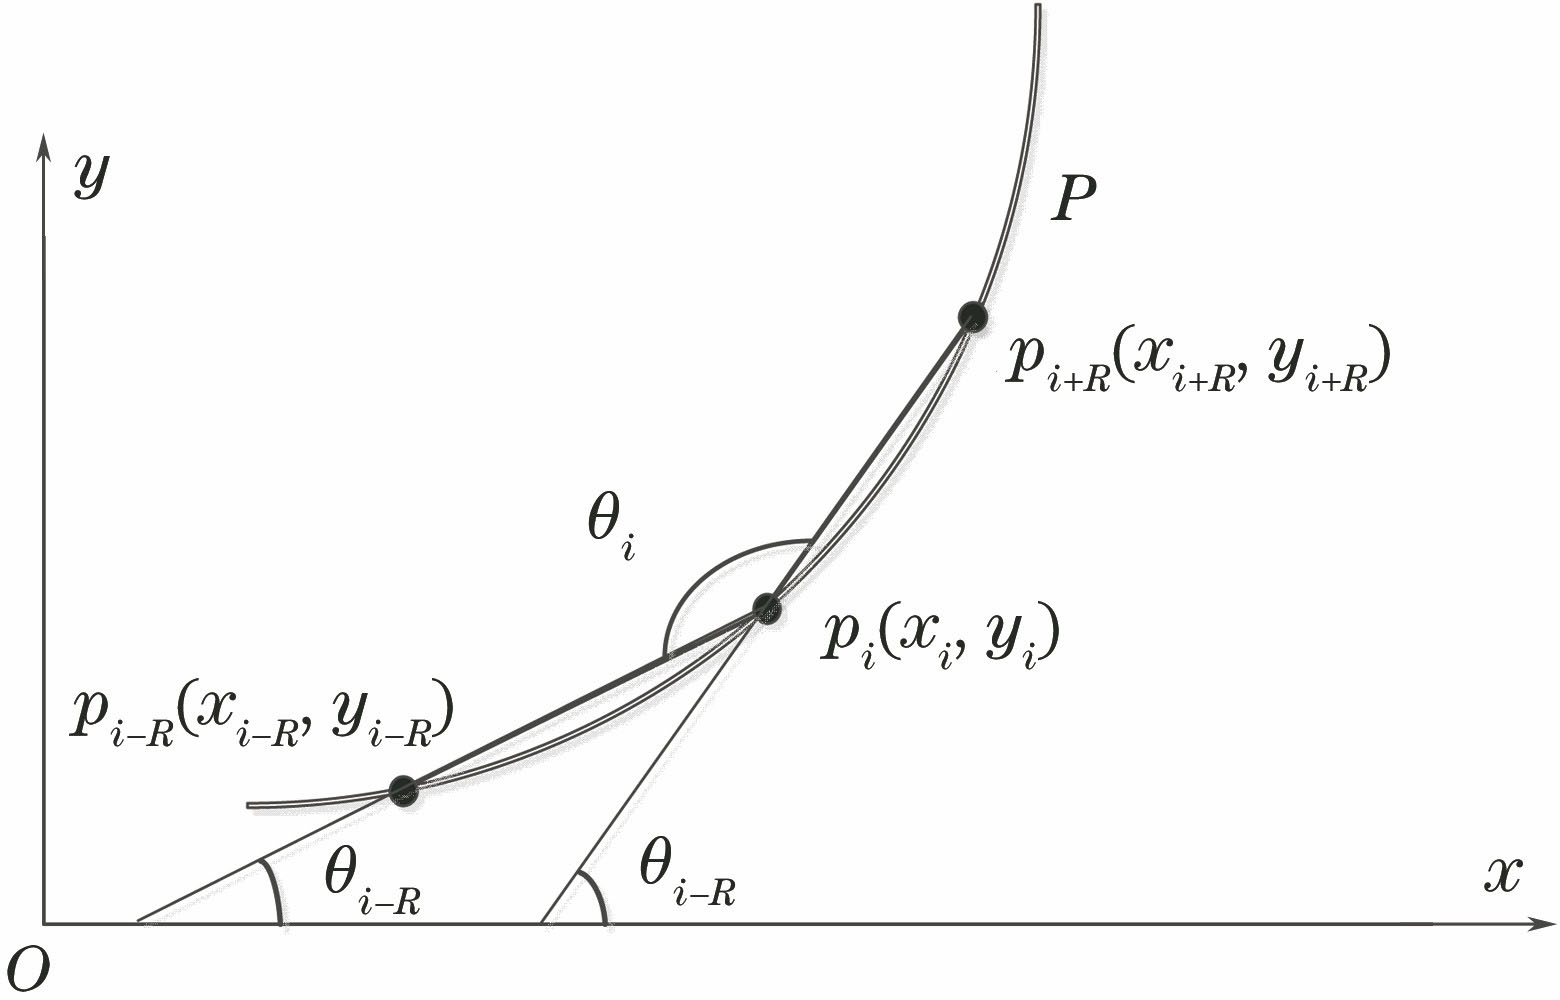
Fig. 2. Schematic of curvature
Fig. 3. Face false edge extraction. (a) Original image; (b) face edge; (c) edge of a Cartesian coordinate system; (d) false edge of largest connected domain and no symmetry
Fig. 4. Face false edge of small slope. (a) t=0; (b) t=0.1; (c) t=0.2; (d) t=0.3
Fig. 5. False edge with a small curvature and opposite direction of the light source
Fig. 6. Edge markup results need to be enhanced before and after improvement. (a) Original image; (b)-(f) improved edge markup results with m is 0.01、0.03、0.05、0.07、0.1, respectively; (g)-(k) corresponding edge markup results before improvement
Fig. 7. Process illumination compensation of proposed method
Fig. 8. Illumination angle is 0°. (a) Original image; (b) improved MSR; (c) PCNN; (d) adaptive Gamma correction; (e) proposed method
Fig. 9. Illumination angle is 15°. (a) Original image; (b) improved MSR; (c) PCNN; (d) adaptive Gamma correction; (e) proposed method
Fig. 10. Illumination angle is -20°. (a) Original image; (b) improved MSR; (c) PCNN; (d) adaptive Gamma correction; (e) proposed method
Fig. 11. Illumination angle is +65°. (a) Original image; (b) improved MSR; (c) PCNN; (d) adaptive Gamma correction; (e) proposed method
Fig. 12. Illumination angle is +90°. (a) Original image; (b) improved MSR; (c) PCNN; (d) adaptive Gamma correction; (e) proposed method
Fig. 13. Experiment of MCU PIE face database. (a) Original images; (b) improved MSR; (c) PCNN; (d) proposed method
Fig. 14. Face recognition rate of different subsets
Fig. 15. Face misjudgment rate of different subsets
|
Table 1. Evaluation values of test image

Set citation alerts for the article
Please enter your email address
© Copyright 2018-2021 | Chinese Laser Press. All Rights Reserved 沪ICP备15018463号-20