
Wei Wu, Zirong Luo, Huizhe Yang, Yujun Cao, Jianzhong Shang. Misalignments calculation method for optical systems based on the ellipticity distribution of stellar image[J]. Infrared and Laser Engineering, 2022, 51(5): 20210391
- Infrared and Laser Engineering
- Vol. 51, Issue 5, 20210391 (2022)
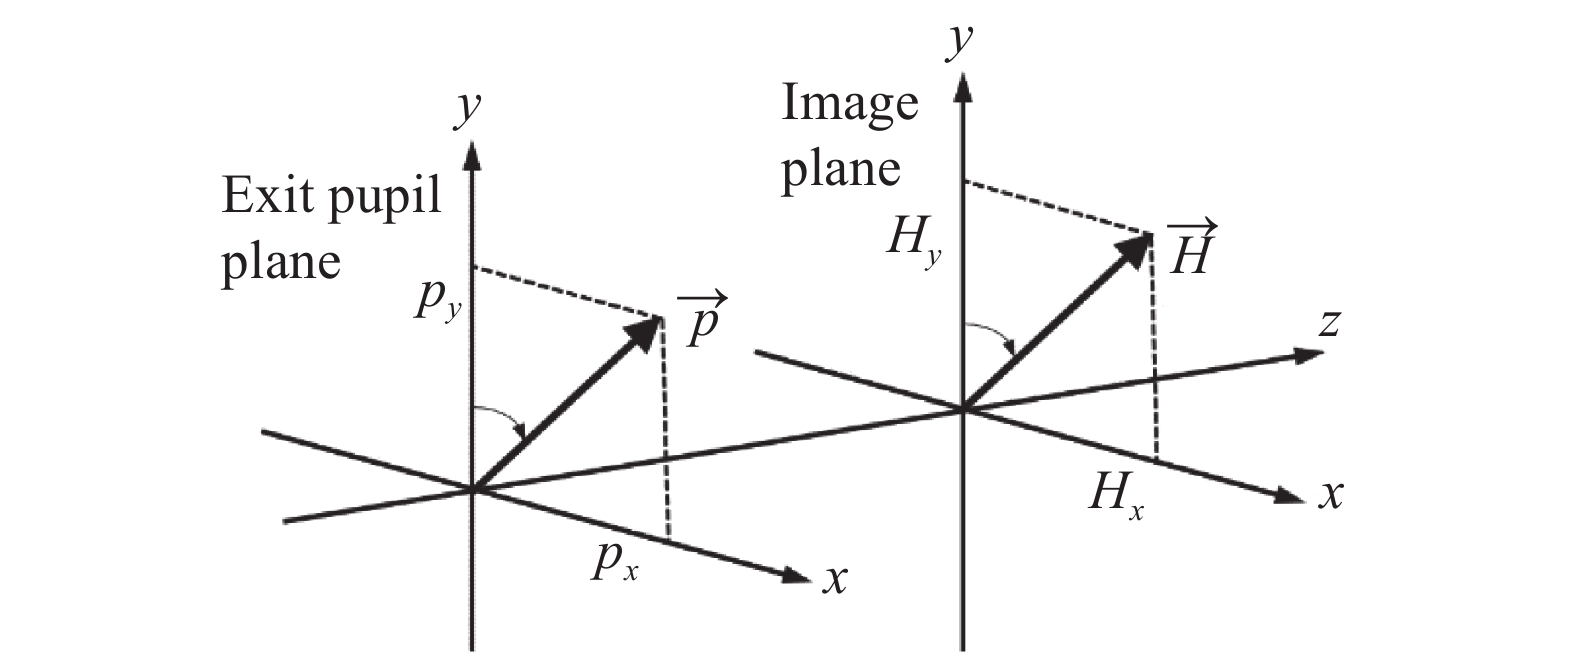
Fig. 1. Conventions for the pupil vector and field vector
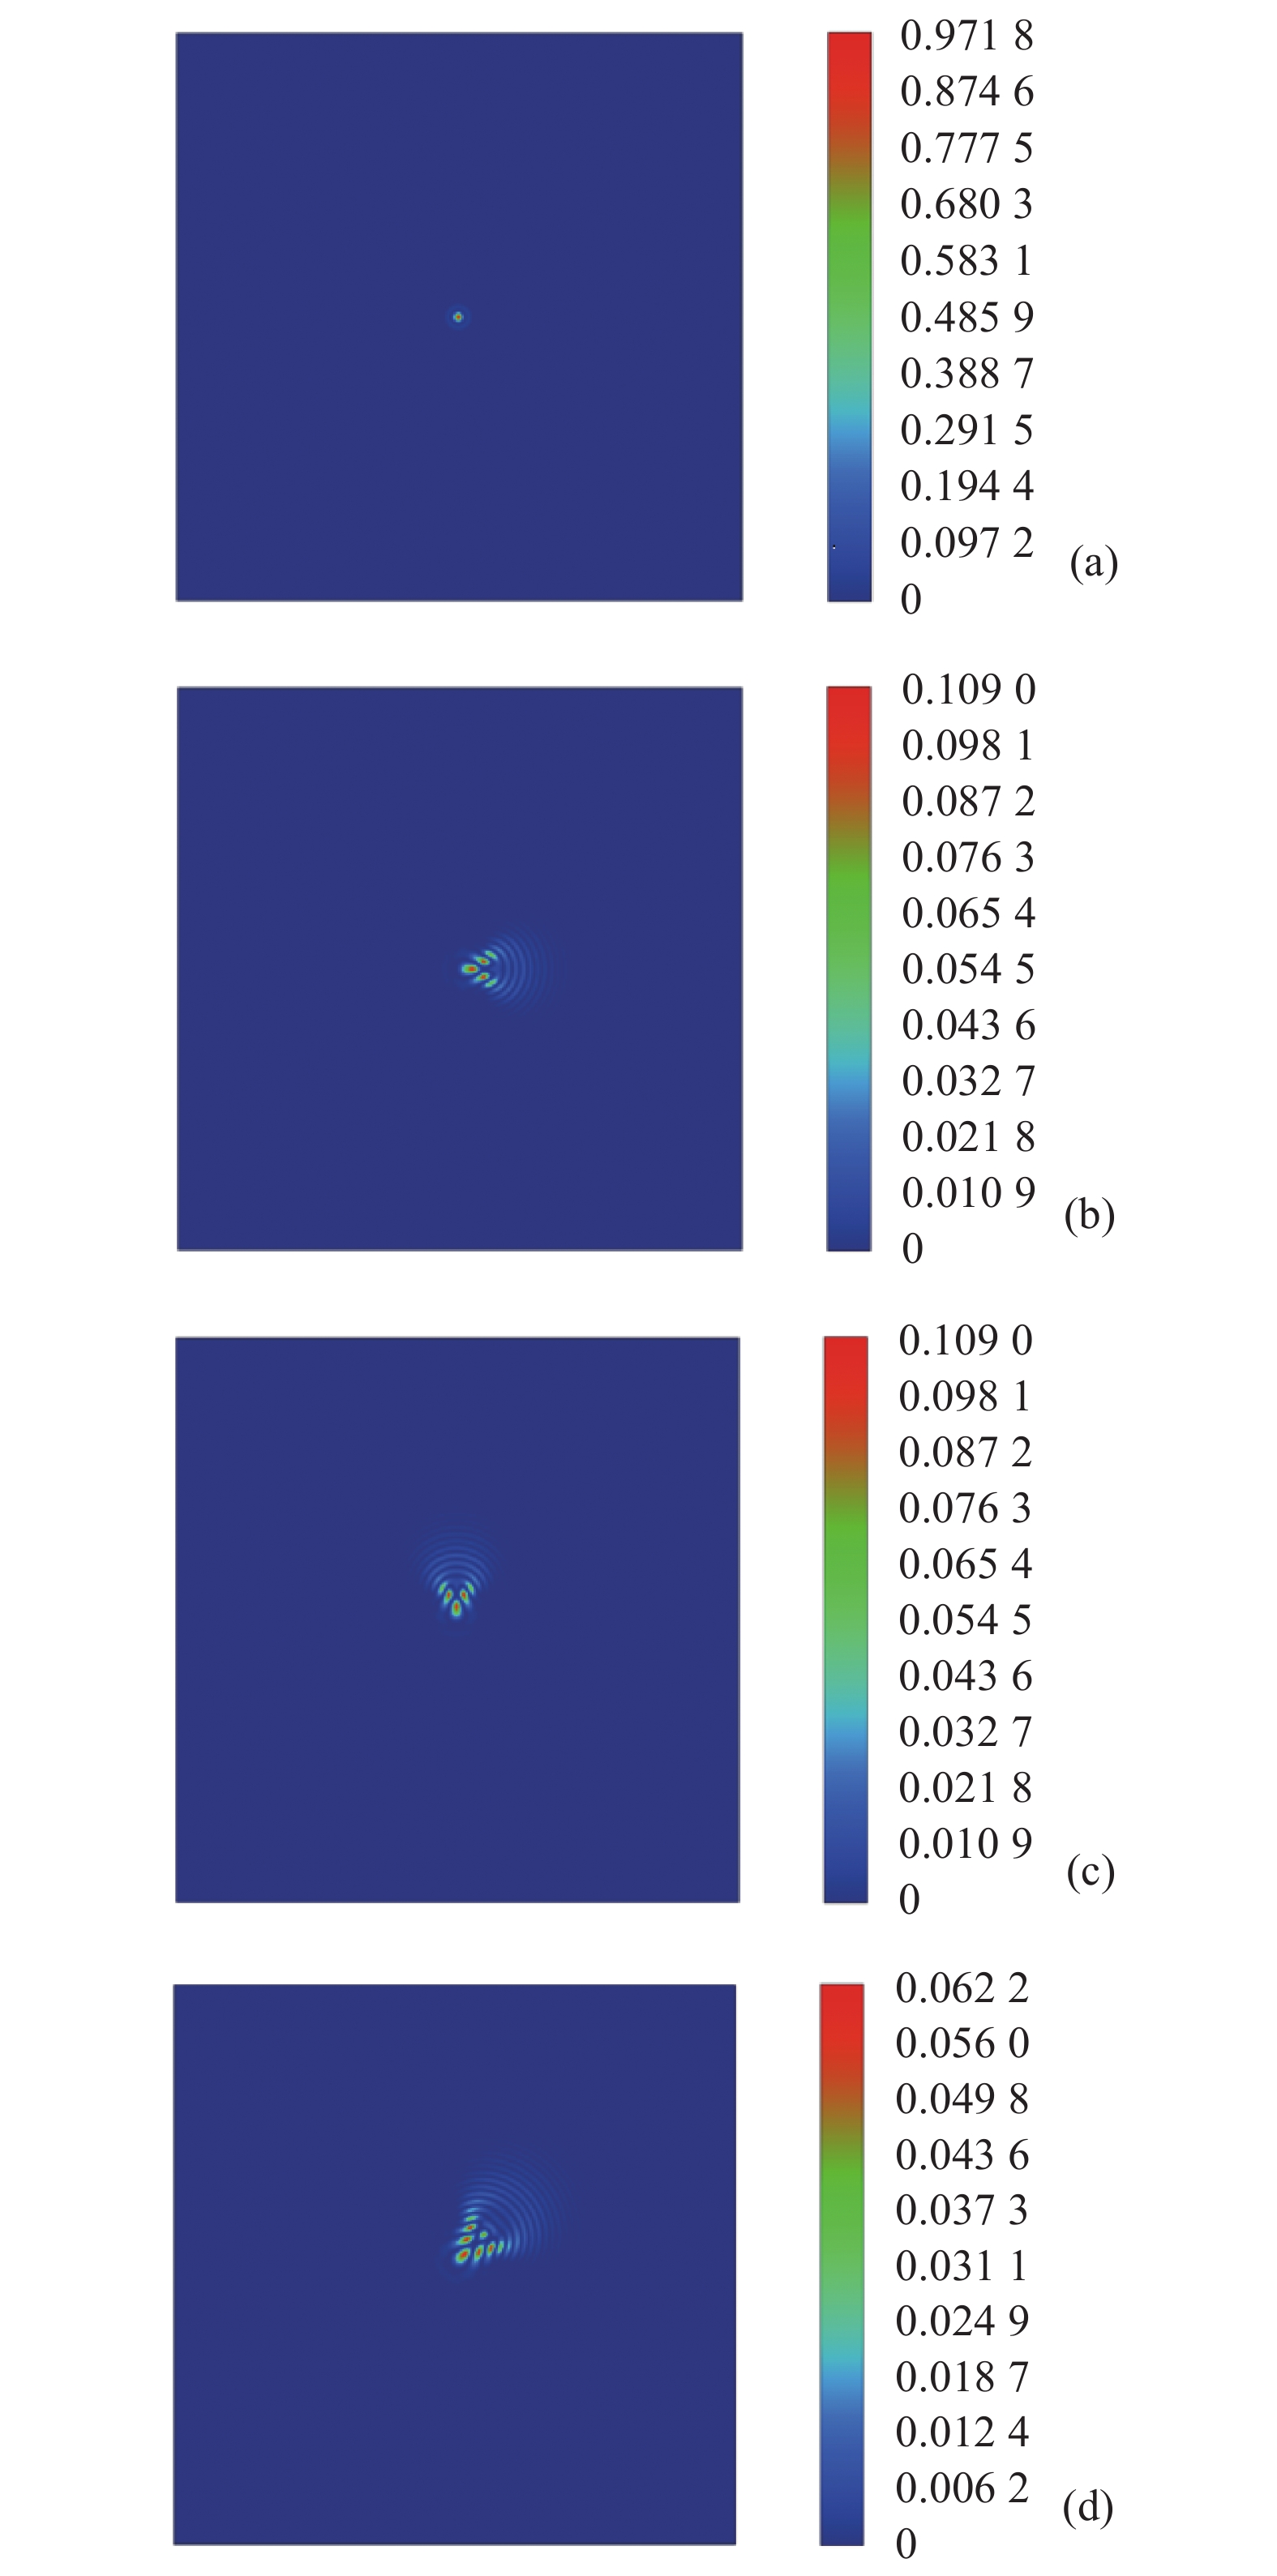
Fig. 2. Stellar images for different assembly errors. (a) Without misalignments, and with misalignment in (b) x direction; (c) y direction and (d) x & y direction
Fig. 3. Flow chart of misalignment calculation
Fig. 4. Optical layout of Hilbert optical system
Fig. 5. Distribution of PSF and ellipticity under different misalignment status. (a) Case 1; (b) Case 2; (c) Case 3; (d) Case 4
Fig. 6. Distribution of ellipticity (a) e 1, (b) e 2 in ideal status
Fig. 7. Distribution of ellipticity (a) e 1e 2 in misaligned status
Fig. 8. Distribution of ellipticity parameter (a) e 1 and (b) e 2 in the case of introduced II, distribution of ellipticity parameter (c) e 1 and (d) e 2 in the case of calculated II
Fig. 9. Processes and results in the case of introduced II. (a) Variation of MF value with iteration times; (b) Distribution of particle swarm after the 1st iteration; (c) Distribution of particle swarm after the 15th iteration; (d) Output misalignment
Fig. 10. Misalignment calculation error in different SNR
|
Table 1. Design parameters for the Hilbert optical system
|
Table 2. Four cases of introduced misalignment status
|
Table 3. Introduced misalignments and calculated results

Set citation alerts for the article
Please enter your email address
© Copyright 2018-2021 | Chinese Laser Press. All Rights Reserved 沪ICP备15018463号-20