• Advanced Photonics
  • Vol. 4, Issue 3, 036001 (2022)
Jintian Lin1、2、†, Saeed Farajollahi3, Zhiwei Fang4, Ni Yao5、6, Renhong Gao1、2, Jianglin Guan4、7, Li Deng4、7, Tao Lu3、*, Min Wang4、7, Haisu Zhang4、7, Wei Fang6、8、*, Lingling Qiao1、2, and Ya Cheng1、2、4、7、9、10、11、*
Author Affiliations
  • 1Chinese Academy of Sciences (CAS), Shanghai Institute of Optics and Fine Mechanics (SIOM), State Key Laboratory of High Field Laser Physics and CAS Center for Excellence in Ultra-Intense Laser Science, Shanghai, China
  • 2University of Chinese Academy of Sciences, Center of Materials Science and Optoelectronics Engineering, Beijing, China
  • 3University of Victoria, Department of Electrical and Computer Engineering, Victoria, British Columbia, Canada
  • 4East China Normal University, School of Physics and Electronic Science, XXL—The Extreme Optoelectromechanics Laboratory, Shanghai, China
  • 5Research Center for Intelligent Sensing, Zhejiang Lab, Hangzhou, China
  • 6Zhejiang University, College of Optical Science and Engineering, The Interdisciplinary Center for Quantum Information, State Key Laboratory of Modern Optical Instrumentation, Hangzhou, China
  • 7East China Normal University, State Key Laboratory of Precision Spectroscopy, Shanghai, China
  • 8Jiaxing Institute of Zhejiang University, Intelligent Optics & Photonics Research Center, Jiaxing, China
  • 9Shanxi University, Collaborative Innovation Center of Extreme Optics, Taiyuan, China
  • 10Shandong Normal University, Collaborative Innovation Center of Light Manipulations and Applications, Jinan, China
  • 11Shanghai Research Center for Quantum Sciences, Shanghai, China
  • show less
    DOI: 10.1117/1.AP.4.3.036001 Cite this Article Set citation alerts
    Jintian Lin, Saeed Farajollahi, Zhiwei Fang, Ni Yao, Renhong Gao, Jianglin Guan, Li Deng, Tao Lu, Min Wang, Haisu Zhang, Wei Fang, Lingling Qiao, Ya Cheng. Electro-optic tuning of a single-frequency ultranarrow linewidth microdisk laser[J]. Advanced Photonics, 2022, 4(3): 036001 Copy Citation Text show less
    The experimental setup for lasing and polarization measurement. A variable optical attenuator (VOA) was used to tune the input power into the Z-cut microdisk. TM and TE represent transverse magnetic and transverse electric polarization states, respectively. Inset: SEM image of the microdisk (without electrodes) and optical micrograph of the microdisk integrated with Cr electrodes.
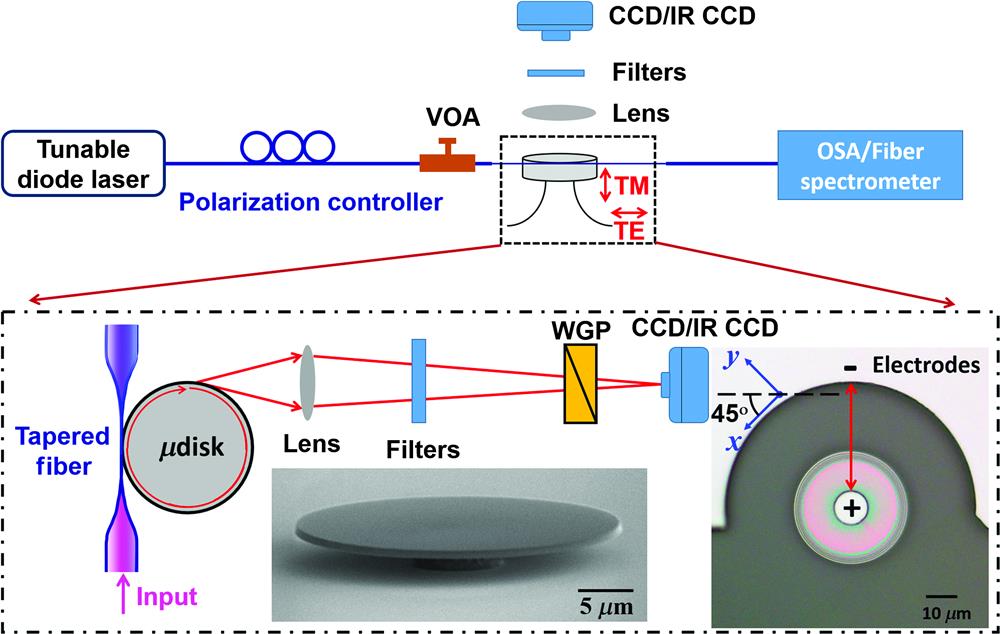
    Fig. 1. The experimental setup for lasing and polarization measurement. A variable optical attenuator (VOA) was used to tune the input power into the Z-cut microdisk. TM and TE represent transverse magnetic and transverse electric polarization states, respectively. Inset: SEM image of the microdisk (without electrodes) and optical micrograph of the microdisk integrated with Cr electrodes.
    (a) Spectra of the microlaser output powers at different pump power levels. (b) The optical micrograph of the square lasing mode at 1546-nm wavelength. Inset: the optical micrographs of the square modes of the upconversion fluorescence around the 550-nm wavelength (left) and the pump light (right). (c) Spectrum of the upconversion fluorescence and the pump light. Inset: optical micrograph of the tapered fiber coupled with the microdisk. (d) Spectrum of lasing. (e) Laser output power versus pump power dropped to the cavity shows a pump threshold of 25 μW. (f) Spectrum of multiple-mode lasing when pumping with a WGM at 971.5-nm wavelength. Inset: the optical micrograph of the upconversion fluorescence, showing a circular pattern along the disk periphery.
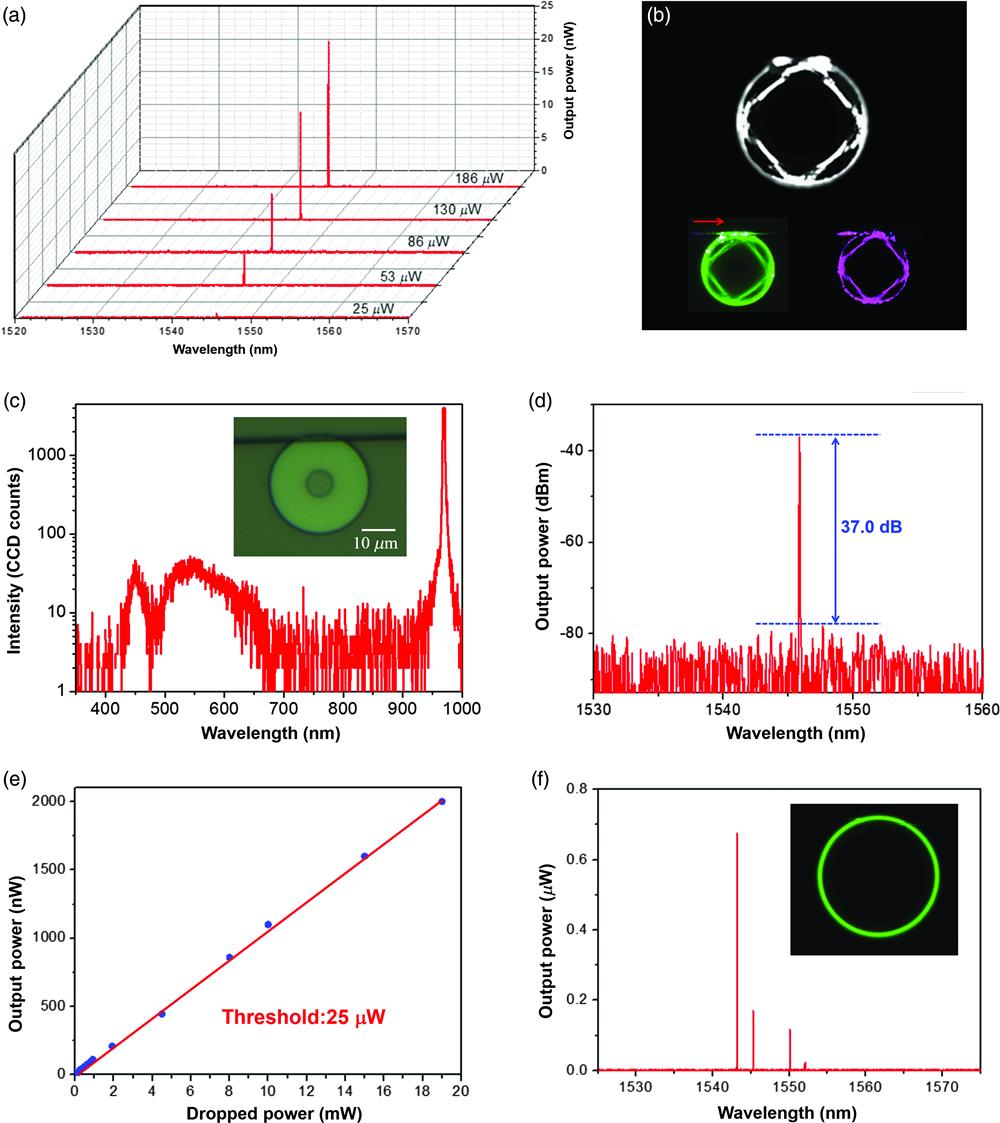
    Fig. 2. (a) Spectra of the microlaser output powers at different pump power levels. (b) The optical micrograph of the square lasing mode at 1546-nm wavelength. Inset: the optical micrographs of the square modes of the upconversion fluorescence around the 550-nm wavelength (left) and the pump light (right). (c) Spectrum of the upconversion fluorescence and the pump light. Inset: optical micrograph of the tapered fiber coupled with the microdisk. (d) Spectrum of lasing. (e) Laser output power versus pump power dropped to the cavity shows a pump threshold of 25  μW. (f) Spectrum of multiple-mode lasing when pumping with a WGM at 971.5-nm wavelength. Inset: the optical micrograph of the upconversion fluorescence, showing a circular pattern along the disk periphery.
    Transmission spectra of the tapered fiber coupled with the microdisk. (a) Transmission spectrum around the pump wavelength, where each blue line segment with two arrows indicates an FSR. (b) The Q factor of the pump mode. (c) The measured highest Q factor of the conventional WGM [indicated with a green triangle in (a)] within one FSR. (d) Spectrum around the lasing wavelength. (e) The Q factor of the lasing mode. (f) The measured highest Q factor of the conventional WGM [indicated with a green rhombus in (d)] within one FSR.
    Fig. 3. Transmission spectra of the tapered fiber coupled with the microdisk. (a) Transmission spectrum around the pump wavelength, where each blue line segment with two arrows indicates an FSR. (b) The Q factor of the pump mode. (c) The measured highest Q factor of the conventional WGM [indicated with a green triangle in (a)] within one FSR. (d) Spectrum around the lasing wavelength. (e) The Q factor of the lasing mode. (f) The measured highest Q factor of the conventional WGM [indicated with a green rhombus in (d)] within one FSR.
    Linewidth measurement. (a) The experimental setup. (b) The spectrum of the detected beating signal for an output power of 2 μW. (c) The measured frequency noise. (d) The linewidth is a function of the output power of the microlaser.
    Fig. 4. Linewidth measurement. (a) The experimental setup. (b) The spectrum of the detected beating signal for an output power of 2  μW. (c) The measured frequency noise. (d) The linewidth is a function of the output power of the microlaser.
    (a) Lasing wavelength drift with different pump powers. (b) Lasing wavelength versus pump power. The linear fitting (red curve) shows a slope of 12.3 pm/mW. Distributions of (c) the scalar electric potential and (d) the vectorial electric field in the microdisk. The arrows denoting the vectorial electric field have a length proportional to the logarithm of the electric field magnitude. The material layers from top to bottom were Cr, LN, silica, and LN, respectively. (e) Lasing wavelength drift with the applied voltage. (f) Lasing wavelength versus applied voltage, showing a high tuning efficiency of 50 pm/100 V.
    Fig. 5. (a) Lasing wavelength drift with different pump powers. (b) Lasing wavelength versus pump power. The linear fitting (red curve) shows a slope of 12.3  pm/mW. Distributions of (c) the scalar electric potential and (d) the vectorial electric field in the microdisk. The arrows denoting the vectorial electric field have a length proportional to the logarithm of the electric field magnitude. The material layers from top to bottom were Cr, LN, silica, and LN, respectively. (e) Lasing wavelength drift with the applied voltage. (f) Lasing wavelength versus applied voltage, showing a high tuning efficiency of 50  pm/100  V.
    The intensity distributions of (a) the square mode and (b) the fundamental WGM at the pump wavelengths. Left column: (c) the square mode, (f) the fundamental WGM, and (i) high order WGM at lasing wavelengths. (d)–(k) The intensity distributions of the integrand between each laser mode in the left column and either pump mode in the top row. Here, the larger overlap (Γ=0.53) in (k) between the pump fundamental WGM and laser high-order WGM suggests that both the fundamental and high-order WGMs are likely to simultaneously lase, while in the case of being pumped by a square mode, the high-order WGM will not lase due to a lower overlap (Γ=0.34).
    Fig. 6. The intensity distributions of (a) the square mode and (b) the fundamental WGM at the pump wavelengths. Left column: (c) the square mode, (f) the fundamental WGM, and (i) high order WGM at lasing wavelengths. (d)–(k) The intensity distributions of the integrand between each laser mode in the left column and either pump mode in the top row. Here, the larger overlap (Γ=0.53) in (k) between the pump fundamental WGM and laser high-order WGM suggests that both the fundamental and high-order WGMs are likely to simultaneously lase, while in the case of being pumped by a square mode, the high-order WGM will not lase due to a lower overlap (Γ=0.34).
    Jintian Lin, Saeed Farajollahi, Zhiwei Fang, Ni Yao, Renhong Gao, Jianglin Guan, Li Deng, Tao Lu, Min Wang, Haisu Zhang, Wei Fang, Lingling Qiao, Ya Cheng. Electro-optic tuning of a single-frequency ultranarrow linewidth microdisk laser[J]. Advanced Photonics, 2022, 4(3): 036001
    Download Citation