Author Affiliations
1Key Laboratory of Regional Sustainable Development Modeling /Institute of Geographic Sciences and Natural Resources Research, CAS, Beijing 100101, China2College of Resources and Environment, University of Chinese Academy of Sciences, Beijing 100049, China3Institute of Strategy Research of Guangdong-Hong Kong-Macao Greater Bay Area, Guangzhou 510070, Chinashow less
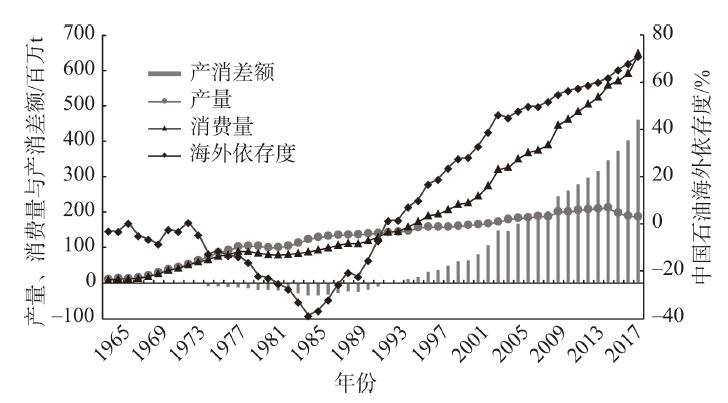
Fig. 1. Changes in China’s overseas dependence of crude oil, 1965-2018
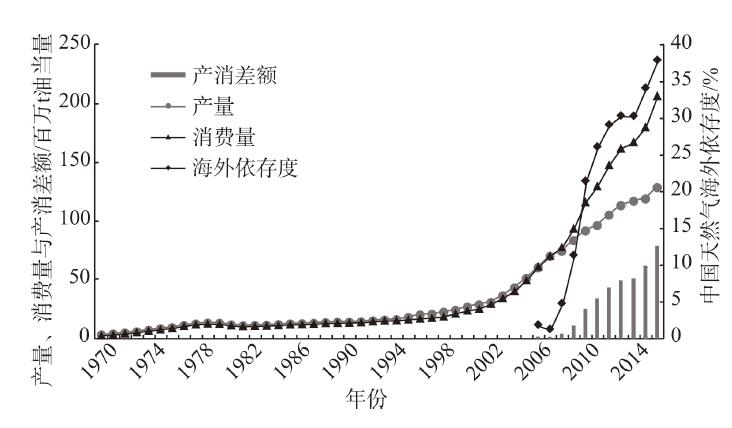
Fig. 2. Changes in China’s overseas dependence of natural gas, 1970-2017
Fig. 3. Changes in U.S. oversea oil dependence, 1965-2018
| 2000年 | 2010年 | 2017年 |
|---|
| 石油进口 | | 进口国总数 | 33 | 50 | 47 | | 前5国家集中率/% | 59.21 | 57.02 | 54.86 | | 前10国家集中率/% | 80.37 | 78.65 | 79.71 | | 前20国家集中率/% | 95.97 | 95.10 | 93.39 | | 液化天然气进口 | | 进口国总数 | —— | 12 | 22 | | 前5国家集中率/% | —— | 91.44 | 89.59 | | 前10国家集中率/% | —— | 98.86 | 96.53 | | 管道天然气 | | 进口国总数 | —— | —— | 4 | | 前5国家集中率/% | —— | —— | 100.00 |
|
Table 1. Centralization degree of China’s oil and gas import countries, 2000, 2010 and 2017
| 2000年 | | 2010年 | | 2017年 |
|---|
| 进口国 | 进口量/百万t | 比重/% | 进口国 | 进口量/百万t | 比重% | 进口国 | 进口量/百万t | 比重/% |
|---|
| 1 | 阿曼 | 70.27 | 22.29 | | 沙特阿拉伯 | 44.65 | 18.66 | | 俄罗斯 | 59.54 | 14.19 | | 2 | 安哥拉 | 15.66 | 12.29 | 安哥拉 | 39.38 | 16.46 | 沙特阿拉伯 | 52.18 | 12.44 | | 3 | 伊朗 | 8.64 | 9.96 | 伊朗 | 21.32 | 8.91 | 安哥拉 | 50.42 | 12.02 | | 4 | 沙特阿拉伯 | 7.00 | 8.16 | 阿曼 | 15.87 | 6.63 | 伊拉克 | 36.82 | 8.78 | | 5 | 印度尼西亚 | 5.73 | 6.51 | 俄罗斯 | 15.24 | 6.37 | 伊朗 | 31.15 | 7.43 | | 6 | 也门 | 4.58 | 5.14 | 苏丹 | 12.60 | 5.26 | 阿曼 | 31.01 | 7.39 | | 7 | 苏丹 | 3.61 | 4.72 | 伊拉克 | 11.24 | 4.70 | 巴西 | 23.09 | 5.50 | | 8 | 伊拉克 | 3.31 | 4.53 | 哈萨克斯坦 | 10.05 | 4.20 | 委内瑞拉 | 21.76 | 5.19 | | 9 | 越南 | 3.18 | 4.50 | 科威特 | 242.60 | 3.15 | 科威特 | 18.24 | 4.35 | | 10 | 卡塔尔 | 3.16 | 2.28 | 巴西 | 165.30 | 2.15 | 阿联酋 | 10.16 | 2.42 |
|
Table 2. Major oil suppliers to China and China’s import share, 2000, 2010, and 2017
| 2014年 | | 2017年 |
|---|
| 进口国 | 进口量/百万t | 比重/% | 进口国 | 进口量/百万t | 比重/% |
|---|
| 液化天然气 | | 1 | 卡塔尔 | 6.73 | 33.96 | | 澳大利亚 | 17.27 | 45.33 | | 2 | 澳大利亚 | 3.81 | 19.23 | 卡塔尔 | 7.48 | 19.64 | | 3 | 马来西亚 | 2.99 | 15.10 | 马来西亚 | 4.21 | 11.06 | | 4 | 印度尼西亚 | 2.55 | 12.89 | 印度尼西亚 | 3.07 | 8.05 | | 5 | 也门 | 1.02 | 5.17 | 巴布新几内亚 | 2.10 | 5.51 | | 6 | 赤道几内亚 | 0.71 | 3.61 | 美国 | 1.51 | 3.97 | | 7 | 尼日利亚 | 0.43 | 2.16 | 俄罗斯 | 0.44 | 1.17 | | 8 | 巴布新几内亚 | 0.29 | 1.44 | 尼日利亚 | 0.33 | 0.87 | | 9 | 阿尔及利亚 | 0.24 | 1.19 | 安哥拉 | 0.26 | 0.68 | | 10 | 西班牙 | 0.19 | 0.95 | 阿曼 | 0.25 | 0.65 | | 管道天然气 | | 1 | 土库曼斯坦 | 18.74 | 81.41 | | 土库曼斯坦 | 24.51 | 80.55 | | 2 | 缅甸 | 2.20 | 9.56 | 缅甸 | 2.52 | 8.27 | | 3 | 乌兹别克斯坦 | 1.79 | 7.76 | 乌兹别克斯坦 | 2.59 | 8.52 | | 4 | 哈萨克斯坦 | 0.29 | 1.27 | 哈萨克斯坦 | 0.81 | 2.66 |
|
Table 3. Major natural gas suppliers to China and China’s import share, 2014 and 2017
| 重点地区 | 主要国家 | 对外供应潜力 | 大国干预 | 内政稳定 | 经济增长 | 军事安全 | 民生民意 | 区域主要特征 |
|---|
| 石油 | 天然气 |
|---|
| 中东地区 | 沙特 | 395.96 | - | ★ | ★ | ★ | ★ | ★ | • 复杂的地缘政治格局• 内外部政治环境严峻• 区域战争与冲突贫乏• 美国核心控制地区• 油气资源非常丰富• 核心国上游资源限制 | | 伊朗 | 153.23 | 8.13 | ★★★ | ★★ | ★★★ | ★★★ | ★★ | | 伊拉克 | 183.10 | - | ★★★ | ★★★ | ★★★ | ★★★ | ★★★ | | 阿曼 | 38.61 | - | ★ | ★ | ★ | ★ | ★ | | 科威特 | 126.50 | - | ★★ | ★ | ★ | ★ | ★ | | 阿联酋 | 133.26 | - | ★ | ★ | ★ | ★ | ★ | | 卡塔尔 | 67.56 | 110.33 | ★★ | ★ | ★★ | ★★ | ★★ | | 非洲 | 安哥拉 | 81.83 | - | ★★ | ★ | ★★★ | ★★ | ★★ | • 产油国众多,多国博弈• 西方公司先入为主• 没有重大资金限制• 对华外交关系总体良好 | | 阿尔及利亚 | 47.93 | 45.02 | ★★ | ★★★ | ★★★ | ★★★ | ★★★ | | 尼日利亚 | 95.25 | 40.59 | ★ | ★★ | ★★ | ★★ | ★★ | | 拉丁美洲 | 委内瑞拉 | 85.06 | - | ★★★ | ★★★ | ★★★ | ★★★ | ★★★ | • 经济脆弱程度高• 国有化风险• 政治敏感高 | | 巴西 | - | - | ★★ | ★★ | ★ | ★ | ★ | | 墨西哥 | 26.80 | - | ★ | ★ | ★ | ★ | ★ | | 俄罗斯及中亚 | 俄罗斯 | 406.58 | 181.26 | ★★ | ★ | ★ | ★ | ★ | • 高资金需求• 限制上游投资• 经济结构单一• 陆地毗邻,管道风险低 | | 哈萨克斯坦 | 72.80 | - | ★★ | ★★ | ★ | ★ | ★ | | 土库曼斯坦 | - | 28.92 | ★★ | ★ | ★ | ★ | ★ | | 乌兹别克斯坦 | - | 10.11 | ★★ | ★ | ★ | ★ | ★★ | | 亚太地区 | 澳大利亚 | - | 61.56 | ★ | ★ | ★ | ★ | ★ | • 新的全球能源中心• 经济增长迅速• 对华政策不稳定 | | 印度尼西亚 | - | 24.77 | ★ | ★ | ★ | ★ | ★ | | 马来西亚 | - | 30.63 | ★ | ★ | ★ | ★ | ★ |
|
Table 4. Global geopolitical risks of the main oil and gas production areas
| 2016年 | | 2017年 | | 2018年 |
|---|
| 出口国 | 出口量/百万t | 比重/% | 出口国 | 出口量/百万t | 比重/% | 出口国 | 出口量/百万t | 比重/% |
|---|
| 1 | 加拿大 | 20.92 | 60.82 | | 加拿大 | 20.52 | 30.54 | | 加拿大 | 21.94 | 18.87 | | 2 | 荷兰 | 2.50 | 7.28 | 中国 | 12.84 | 19.11 | 韩国 | 13.70 | 11.78 | | 3 | 库拉索 | 1.72 | 5.01 | 英国 | 5.62 | 8.37 | 中国 | 13.25 | 11.39 | | 4 | 中国 | 1.27 | 3.69 | 荷兰 | 5.35 | 7.96 | 英国 | 9.50 | 8.17 | | 5 | 意大利 | 1.19 | 3.46 | 韩国 | 3.23 | 4.80 | 荷兰 | 8.45 | 7.27 | | 6 | 英国 | 0.86 | 2.50 | 意大利 | 2.89 | 4.31 | 印度 | 7.67 | 6.59 | | 7 | 瑞士 | 0.82 | 2.38 | 法国 | 1.63 | 2.43 | 意大利 | 7.31 | 6.29 | | 8 | 韩国 | 0.62 | 1.80 | 印度 | 1.53 | 2.28 | 日本 | 3.72 | 3.20 | | 9 | 新加坡 | 0.62 | 1.79 | 新加坡 | 1.52 | 2.26 | 新加坡 | 3.69 | 3.17 | | 10 | 哥伦比亚 | 0.56 | 1.62 | 日本 | 1.48 | 2.20 | 泰国 | 2.32 | 1.99 |
|
Table 5. Top 10 U.S. oil exporters and their export share, 2016-2018
| 2016年 | | 2017年 | | 2018年 |
|---|
| 出口国 | 出口额/亿美元 | 比重/% | 出口国 | 出口额/亿美元 | 比重/% | 出口国 | 出口额/亿美元 | 比重/% |
|---|
| 1 | 智利 | 2.16 | 22.50 | | 墨西哥 | 6.52 | 18.79 | | 韩国 | 12.84 | 21.87 | | 2 | 中国 | 1.37 | 14.23 | 韩国 | 5.96 | 17.18 | 墨西哥 | 8.70 | 14.81 | | 3 | 墨西哥 | 1.21 | 12.63 | 中国 | 4.24 | 12.21 | 日本 | 8.25 | 14.05 | | 4 | 印度 | 1.04 | 10.84 | 日本 | 3.37 | 9.70 | 中国 | 5.14 | 8.75 | | 5 | 日本 | 0.73 | 7.64 | 约旦 | 2.05 | 5.90 | 印度 | 3.52 | 6.00 | | 6 | 约旦 | 0.59 | 6.10 | 土耳其 | 1.76 | 5.06 | 英国 | 2.97 | 5.06 | | 7 | 土耳其 | 0.58 | 6.07 | 智利 | 1.45 | 4.17 | 巴西 | 2.06 | 3.51 | | 8 | 巴西 | 0.48 | 5.01 | 葡萄牙 | 1.34 | 3.87 | 约旦 | 2.03 | 3.46 | | 9 | 阿根廷 | 0.39 | 4.06 | 西班牙 | 1.22 | 3.52 | 阿根廷 | 1.89 | 3.23 | | 10 | 埃及 | 0.23 | 2.42 | 科威特 | 1.15 | 3.32 | 智利 | 1.76 | 2.99 |
|
Table 6. Top 10 U.S. natural gas exporters and their export share, 2016-2018
| 印度 | | 日本 | | 韩国 |
|---|
| 进口国 | 进口量/百万t | 比重/% | 进口国 | 进口量/百万t | 比重/% | 进口国 | 进口量/百万t | 比重/% |
|---|
| 1 | 伊拉克 | 42.17 | 19.48 | | 沙特阿拉伯 | 63.43 | 40.15 | | 沙特阿拉伯 | 43.06 | 28.96 | | 2 | 沙特阿拉伯 | 35.85 | 16.56 | 阿联酋 | 37.70 | 23.87 | 科威特 | 22.25 | 14.96 | | 3 | 伊朗 | 24.28 | 11.22 | 卡塔尔 | 11.54 | 7.31 | 伊朗 | 18.07 | 12.15 | | 4 | 委内瑞拉 | 19.43 | 8.97 | 科威特 | 11.53 | 7.30 | 伊拉克 | 17.84 | 12.00 | | 5 | 尼日利亚 | 16.98 | 7.84 | 俄罗斯 | 9.01 | 5.70 | 阿联酋 | 12.17 | 8.19 | | 6 | 阿联酋 | 16.56 | 7.65 | 伊朗 | 8.71 | 5.51 | 卡塔尔 | 7.92 | 5.33 | | 7 | 科威特 | 11.18 | 5.16 | 伊拉克 | 2.70 | 1.71 | 俄罗斯 | 6.99 | 4.70 | | 8 | 安哥拉 | 7.78 | 3.59 | 墨西哥 | 2.23 | 1.41 | 墨西哥 | 4.48 | 3.01 | | 9 | 墨西哥 | 7.50 | 3.46 | 印尼 | 1.91 | 1.21 | 英国 | 4.47 | 3.01 | | 10 | 巴西 | 4.61 | 2.13 | 阿曼 | 1.58 | 1.00 | 美国 | 1.77 | 1.19 |
|
Table 7. Top 10 importing countries for India, Japan, and South Korea, 2017