• Laser & Optoelectronics Progress
  • Vol. 60, Issue 10, 1010009 (2023)
Zongsheng Zheng, Jiahui Zhao*, Peng Lu, Guoliang Zou, and Zhenhua Wang
Author Affiliations
  • College of Information Technology, Shanghai Ocean University, Shanghai 201306, China
  • show less
    DOI: 10.3788/LOP213379 Cite this Article Set citation alerts
    Zongsheng Zheng, Jiahui Zhao, Peng Lu, Guoliang Zou, Zhenhua Wang. Location of Typhoon Center Based on Multi-Scale Mosaic Mask R-CNN[J]. Laser & Optoelectronics Progress, 2023, 60(10): 1010009 Copy Citation Text show less
    Model architecture diagram
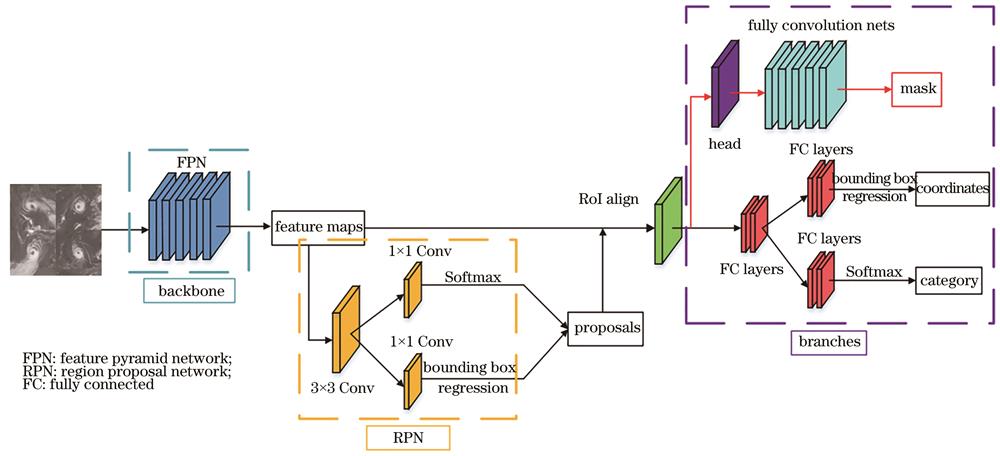
    Fig. 1. Model architecture diagram
    Original labeled data. (a) Sample 1; (b) sample 2; (c) sample 3; (d) sample 4
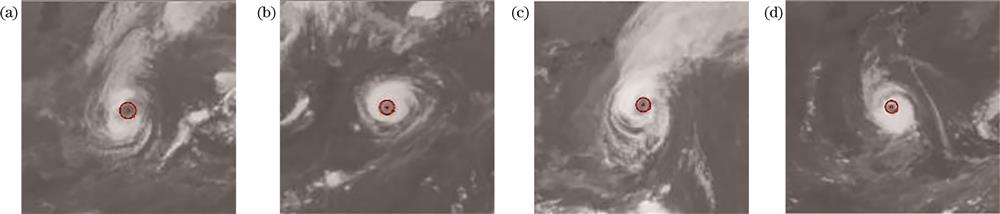
    Fig. 2. Original labeled data. (a) Sample 1; (b) sample 2; (c) sample 3; (d) sample 4
    Fused data
    Fig. 3. Fused data
    Satellite cloud image data. (a) Sample 1; (b) sample 2; (c) sample 3; (d) sample 4
    Fig. 4. Satellite cloud image data. (a) Sample 1; (b) sample 2; (c) sample 3; (d) sample 4
    Sample drawing of detect results. (a) Sample 1; (b) sample 2; (c) sample 3; (d) sample 4
    Fig. 5. Sample drawing of detect results. (a) Sample 1; (b) sample 2; (c) sample 3; (d) sample 4
    Loss function figure of Mask R-CNN model
    Fig. 6. Loss function figure of Mask R-CNN model
    Loss function figures of Mask R-CNN model combined with data augmentation. (a) Proposed multi-scale mosaic; (b) Cutout; (c) CutMix; (d) mosaic
    Fig. 7. Loss function figures of Mask R-CNN model combined with data augmentation. (a) Proposed multi-scale mosaic; (b) Cutout; (c) CutMix; (d) mosaic
    Deep learning method for locating typhoon center. (a) Faster R-CNN; (b) YOLOv3; (c) Mask R-CNN
    Fig. 8. Deep learning method for locating typhoon center. (a) Faster R-CNN; (b) YOLOv3; (c) Mask R-CNN
    Fitting diagrams of real coordinates and segmented coordinates of model. (a) HAISHEN; (b) VAMCO
    Fig. 9. Fitting diagrams of real coordinates and segmented coordinates of model. (a) HAISHEN; (b) VAMCO
    Level of scaleRadius sizeNumber of pictures
    Smallr< 1.431467
    Middle1.43 ≤r< 1.901467
    Larger≥ 1.901466
    Table 1. Scale division of typhoon eye
    HyperparameterValue
    NMS-thresh0.45
    Score-thresh0.5
    Maximum iterations40000
    Model checkpoint2
    Learning rate10-4-10-6
    Weight decay5×10-4
    GPU number1
    Input size128×128
    Table 2. Universal hyperparameter settings
    Scale combinationNumberMSEMean MSEMIoUMean MIoUMPAMean MPAFPSMean FPS
    Master model138020.90860.895920.4
    Large+Middle1215425540.94540.94210.92630.921817.120.6
    229810.93840.917023.3
    325270.94260.922121.5
    Large+Small1329034150.93220.93130.90980.911519.421.4
    237470.92700.906122.7
    332080.93480.918622.2
    Middle+Small1368541760.92590.91510.88360.889620.820.7
    247610.91510.890819.8
    340820.90440.894421.5
    Large+Middle+Small1312533550.91870.92220.89680.904322.120
    235880.92210.904718.7
    333510.92580.911319.2
    Table 3. Results of multi-scale experiments
    ModelMIoUSMIoUMMIoULMPASMPAMMPAL
    Mask R-CNN0.88800.91450.92330.88300.88310.9216
    Mask R-CNN+Proposed multi-scale mosaic0.93050.94690.94890.90900.91970.9367
    Table 4. Comparison of wind eye segmentation results at different scales
    ModelData augmentation methodMSEMIoUMPAFPS
    Mask R-CNN38020.90860.895920.4
    Proposed multi-scale mosaic25540.94210.921820.6
    Cutout53730.85690.824722.8
    CutMix40060.91350.906117.0
    mosaic32490.92070.907415.4
    Table 5. Experimental results of each data augmentation
    ModelMean errorMean variance
    LongitudeLatitudeLongitudeLatitude
    Faster R-CNN0.310.260.0550.046
    YOLOv30.280.250.0430.039
    Mask R-CNN+Proposed multi-scale mosaic0.170.190.0280.025
    Table 6. Comparison of location accuracy of typhoon center
    Zongsheng Zheng, Jiahui Zhao, Peng Lu, Guoliang Zou, Zhenhua Wang. Location of Typhoon Center Based on Multi-Scale Mosaic Mask R-CNN[J]. Laser & Optoelectronics Progress, 2023, 60(10): 1010009
    Download Citation