Author Affiliations
1College of Grassland and Environment Sciences, Xinjiang Agricultural University, Urumqi, Xinjiang 830052, China2School of Geography and Tourism, Anhui Normal University, Wuhu, Anhui 241000, China3College of Computer and Information Engineering, Chuzhou University, Chuzhou, Anhui 239000, China4College of Geography and Tourism, Xinjiang Normal University, Urumqi, Xinjiang 830001, Chinashow less
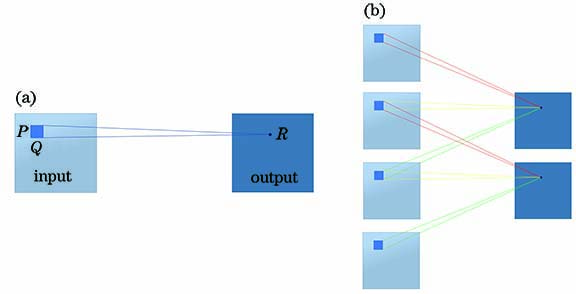
Fig. 1. Principle comparison between 3D-CNN and 2D-CNN. (a) 2D-CNN; (b) 3D-CNN
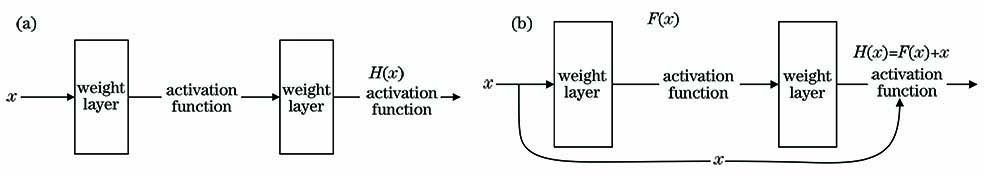
Fig. 2. Diagram of network structure. (a) Flat network; (b) ResNet
Fig. 3. Structure of 3D-RCNN
Fig. 4. Distribution of study area and samples
Fig. 5. Correlation matrix of characteristic factors. (a) Spectral feature; (b) texture feature; (c) vegetation index feature
Fig. 6. Sample expansion by inner ring rotation
Fig. 7. Influence of number of convolution units on test time and overall accuracy
Fig. 8. Influence of step size on test time and overall accuracy
Fig. 9. Tree species distribution. (a) Forest inventory; (b) algorithm extraction
Sensor | Product number | Latitude and longitude of center | Imaging time | Cloud cover /% |
---|
GF-5 AHIS | 45157 | 118.02°E,32.30°N | 2019-05-22 | | GF-6 PMS | 1119873930 | 117.90°E,32.10°N | 2019-05-01 | <5 |
|
Table 1. Basic information of remote-sensing image data
Tree species | Measured samples | Expanded samples | Regular samples | Sample set |
---|
Quercus acutissima | 64 | 100 | 231 | 3696 | Celtissinensis | 72 | 100 | 197 | 3152 | Dalbergiahupeana | 66 | 100 | 147 | 2352 | Pinus massoniana | 70 | 100 | 292 | 4672 | Pinus elliottii | 77 | 100 | 206 | 3296 | Cunninghamia lanceolate | 78 | 100 | 175 | 2800 | Others | 52 | 60 | 155 | 2480 |
|
Table 2. Number of samples
P | Training time /s | Test time /s | OA /% |
---|
3 | 879.22 | 9.12 | 83.22 | 15 | 1020.55 | 11.22 | 83.95 | 17 | 1159.53 | 14.71 | 84.87 | 19 | 1362.99 | 33.53 | 84.90 | 21 | 1505.88 | 52.12 | 84.73 | 23 | 1817.58 | 88.60 | 84.85 |
|
Table 3. Influence of input pixel size on operation time and overall accuracy
Q | Test time /s | OA /% |
---|
3×3×3 | 76.20 | 90.27 | 5×5×5 | 80.10 | 90.79 | 7×7×7 | 88.01 | 90.28 | 9×9×9 | 105.61 | 90.52 |
|
Table 4. Influence of convolution kernel size on operation time and overall accuracy
S | Number of iterations | OA /% |
---|
0.0001 | 986 | 90.56 | 0.0002 | 776 | 90.92 | 0.0003 | 602 | 91.47 | 0.0004 | 474 | 91.69 | 0.0005 | 522 | 91.22 | 0.0006 | 439 | 90.03 | 0.0007 | 659 | 89.87 | 0.0008 | 755 | 90.21 | 0.0009 | 710 | 90.42 | 0.0010 | 928 | 89.15 |
|
Table 5. Influence of learning rate on convergence rate and overall accuracy
Algorithm | Parameter | Species 1 | Species 2 | Species 3 | Species 4 | Species 5 | Species 6 | Species 7 |
---|
| UA /% | 90.29 | 88.53 | 93.85 | 97.14 | 93.24 | 90.26 | 91.63 | 3D-RCNN | PA/% | 95.63 | 92.26 | 97.46 | 86.97 | 92.76 | 89.57 | 94.96 | | OA /% | | | | 91.72 | | | | | Kappa | | | | 0.849 | | | | | UA /% | 80.72 | 87.51 | 90.23 | 88.76 | 87.57 | 87.69 | 81.11 | 3D-CNN | PA/% | 90.12 | 83.66 | 87.55 | 84.84 | 86.89 | 80.19 | 82.68 | | OA /% | | | | 85.65 | | | | | Kappa | | | | 0.820 | | | | | UA /% | 87.50 | 77.50 | 92.50 | 95.00 | 72.50 | 82.50 | 91.67 | SVM | PA /% | 94.59 | 83.78 | 94.87 | 86.36 | 72.50 | 86.84 | 75.86 | | OA /% | | | | 85.22 | | | | | Kappa | | | | 0.827 | | | |
|
Table 6. Classification accuracy evaluation matrix of each algorithm
Parameter | Species 1 | Species 2 | Species 3 | Species 4 | Species 5 | Species 6 | Species 7 |
---|
Statistical area /km2 | 7.815 | 10.418 | 1.574 | 4.227 | 4.754 | 1.708 | 4.721 | Identified area /km2 | 7.156 | 9.266 | 1.590 | 4.350 | 5.047 | 1.677 | 3.866 | RA /% | 91.57 | 88.94 | 99.00 | 97.08 | 93.83 | 98.15 | 81.89 | Average RA /% | | | | 92.92 | | | |
|
Table 7. Accuracy verification of tree species area