Jitao Gao1,†, Elham Nazemosadat2,†, Chen Yang3, Songnian Fu1,*..., Ming Tang1, Weijun Tong3, Joel Carpenter4, Jochen Schröder2, Magnus Karlsson2 and Peter A. Andrekson2|Show fewer author(s)
1Wuhan National Laboratory for Optoelectronics, and School of Optics and Electronic Information, Huazhong University of Science and Technology, Wuhan 430074, China
2Photonics Laboratory, Department of Microtechnology and Nanoscience, Chalmers University of Technology, Gothenburg 41296, Sweden
3State Key Laboratory of Optical Fiber and Cable Manufacture Technology, Yangtze Optical Fiber and Cable Joint Stock Limited Company (YOFC), Wuhan 430073, China
4School of Information Technology and Electrical Engineering, The University of Queensland, Brisbane, QLD 4072, Australia
Jitao Gao, Elham Nazemosadat, Chen Yang, Songnian Fu, Ming Tang, Weijun Tong, Joel Carpenter, Jochen Schröder, Magnus Karlsson, Peter A. Andrekson, "Design, fabrication, and characterization of a highly nonlinear few-mode fiber," Photonics Res. 7, 1354 (2019)
Copy Citation Text
We present the design, fabrication, and characterization of a highly nonlinear few-mode fiber (HNL-FMF) with an intermodal nonlinear coefficient of , which to the best of our knowledge is the highest reported to date. The graded-index circular core fiber supports two mode groups (MGs) with six eigenmodes and is highly doped with germanium. This breaks the mode degeneracy within the higher-order MG, leading to different group velocities among corresponding eigenmodes. Thus, the HNL-FMF can support multiple intermodal four-wave mixing processes between the two MGs at the same time. In a proof-of-concept experiment, we demonstrate simultaneous intermodal wavelength conversions among three eigenmodes of the HNL-FMF over the C band.
1. INTRODUCTION
Multicore and multimode fibers have gained interest in recent years, as they can potentially increase the capacity of telecommunication systems by transmitting data through individual cores or spatial modes of the fiber [1–3]. In data transmission, any nonlinear interaction among the cores of a multicore fiber or the spatial modes of a multimode fiber should be avoided, as it leads to cross talk. However, based on the characteristics found in a multimode fiber [4], intentional nonlinear interactions in such fibers could be used for ultrafast all-optical signal processing applications such as multimode parametric amplification [5–7], mode and wavelength conversion [8–14], optical switching [15], multimode supercontinuum generation [16], and construction of high-power fiber lasers [17]. Such applications have motivated research on both intramodal [5,7] and intermodal four-wave mixing (FWM) processes in multimode fibers [18–22].
In an intramodal FWM process, where all the participating waves are in the same spatial mode, to achieve phase matching over a wide bandwidth, the pump should be placed close to the zero-dispersion wavelength and in the anomalous dispersion regime [23,24]. Intermodal FWM processes have a more flexible phase-matching condition, as they can be phase matched away from the zero-dispersion wavelength, thanks to the different dispersion properties of individual spatial modes [25]. This makes intermodal processes particularly interesting. The main intermodal FWM processes, known as phase conjugation (PC) and Bragg scattering (BS), lead to wavelength and mode conversion. In the PC process, two pump beams amplify a signal and generate a phase-conjugated idler, while in the BS process two pumps mediate an exchange of energy between the signal and idler photons [26].
To date, most studies conducted on intermodal nonlinear processes have been carried out in commercially available few-mode fibers (FMFs), which have a relatively low intermodal nonlinear coefficient of less than [8]. To increase the efficiency of these nonlinear interactions, reduce power consumption, and shorten the fiber length [14], FMF with a high nonlinear coefficient would be beneficial, which can be realized by raising the germanium doping concentration and decreasing the intermodal effective area. Recently, a dispersion-engineered highly nonlinear FMF (HNL-FMF) with an intermodal effective area of μ has been reported, where intermodal wavelength conversion was demonstrated over 40 nm [27]. Here, we report HNL-FMF with a smaller intermodal effective area of less than μ, corresponding to an intermodal nonlinear coefficient of , which is to the best of our knowledge the highest reported to date. In addition, the non-degenerate eigenmodes in the higher-order mode group (MG) of the HNL-FMF have different group velocities, allowing many intermodal FWM processes to occur at the same time, including interactions among the eigenmodes within one MG. In a proof-of-concept experiment, we demonstrate simultaneous intermodal FWM among three eigenmodes of the HNL-FMF. Moreover, due to its specific dispersion properties, our HNL-FMF could potentially be used to achieve mode exchange, i.e., mode conversion that is not accompanied by wavelength conversion. This is a unique feature of this fiber, as in all other intermodal interactions demonstrated so far, mode conversion and wavelength conversion always occur side by side [9–11].
Sign up for Photonics Research TOC. Get the latest issue of Photonics Research delivered right to you!Sign up now
2. THEORY
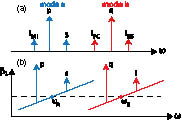
Let us assume that pump at frequency and signal at are launched into the HNL-FMF and coupled to the spatial mode , while pump at frequency is coupled to mode of the HNL-FMF. Intramodal FWM, referred to as modulational instability (MI), leads to the generation of an idler in mode at , if the phase-matching conditions are satisfied. Assuming that both intermodal PC and BS processes are also phase matched, each process generates an idler in mode at and , respectively, as shown in Fig. 1(a). The linear phase mismatches of these processes are and , respectively. In both processes, if we expand and at , and and at , in a Taylor series, respectively, the phase mismatch can be approximated by [8] where and represent the propagation constant and the inverse group velocity of mode at frequency . For simplicity, the contribution of higher-order dispersion terms has been ignored. Note that we do not neglect group velocity dispersion here, because all the even order terms of the propagation constants in the expression of are zero, which means the effect of is already included in the calculated or measured values at the two wavelengths. Equation (1) shows that the PC and BS processes are phase matched () when of mode at the average frequency of the signal and pump in mode , , is nearly equal to of mode at the average frequency of the idler and pump in mode , [8]. In other words, as illustrated in Fig. 1(b), at should lie on the same horizontal line as at for the PC and BS processes [10]. Meanwhile, as shown in Eq. (1), the frequency detuning of the signal from the pump plays a role in the phase mismatch as well. Thus, it is not easy to maintain phase matching for signals that are far away from the pump wavelength.
Figure 1.(a) Schematic of the intramodal and intermodal FWM processes. The colors represent the spatial modes of the waves. (b) The inverse group velocity () versus angular frequency relation required for phase matching in the intermodal processes. The dashed lines indicate the values at the average frequency of the two waves in each mode, which should be equal.
We have designed a circularly symmetric HNL-FMF with a graded index core and a double cladding configuration [7]. The design is optimized so that the dispersion properties of the modes in the two lowest-order MGs fulfill the phase-matching conditions for intermodal FWM over the C band. The refractive index (RI) profile of the designed fiber and that of the fabricated HNL-FMF are shown in Fig. 2(a), where the designed core radius is μ and the RI profile exponent is . The fiber supports two MGs, referred to as MG1 and MG2, respectively. The transverse mode profiles of the supported modes at 1550 nm are depicted in the inset of Fig. 2(a). The core is highly doped with germanium (25 mol. %); thus, the RI difference between the core and cladding is relatively large and consequently the degeneracy between the linearly polarized modes in MG2 is broken. Therefore, the eigenmodes have been considered in this work, where two eigenmodes belong to MG1, while , , and two eigenmodes belong to MG2. The effective RIs of the , , , and modes are 1.4697, 1.4572, 1.4572, and 1.4571, respectively. In MG2, the and modes have slightly different propagation constants, which are also different from those of the degenerate even and odd eigenmodes. Even such small differences in propagation constants lead to different group velocities for the modes within MG2. This can be seen in Fig. 2(b), which shows the simulated relative inverse group velocity () between the supported modes. Taking the of the mode at 1530 nm for reference, the value between the mode and an arbitrary eigenmode at an arbitrary wavelength can be obtained. Even though the RI profile of the fabricated fiber is close to the design, the measured values do not match the simulations, which can be attributed to the inevitable variations along the fiber length during the fiber drawing. Simulations reveal that even small variations of in the and parameters lead to changes of as much as in between the mode in MG1 and any of the eigenmodes in MG2, as shown in Fig. 2(c). Meanwhile, between the eigenmodes within MG2 remains rather constant. The reason is that even though the variations in the fiber parameters affect the propagation constant of the modes (mainly those in MG2, since they are higher-order modes), values within one MG change at a similar rate. Therefore, between any two of the eigenmodes in MG2 almost remains fixed, whereas it changes considerably between MG1 and MG2. Such high sensitivity to the deviation from the optimal parameters should be carefully considered during the fabrication process of the HNL-FMF, given that intermodal FWM interactions rely on the profile of the HNL-FMF. Considering the inevitable fabrication imperfections and inhomogeneous stress caused by microdeformation of the fiber, characterization of values for all guided modes is necessary for practical HNL-FMF-based applications. If we set wavelengths of pumps and signal following the designed , the intermodal FWM processes are very likely to be phase mismatched.
Figure 2.(a) Designed and measured refractive index profiles of the fabricated HNL-FMF at 1550 nm. The effective refractive index of the supported modes and their transverse mode profiles are also shown. (b) Relative inverse group velocity curves of the modes of the designed fiber and (c) those of the modes when the core radius or parameters are changed from their optimal values.
The fiber core has a small radius and a high doping concentration, leading to a relatively high nonlinearity. The nonlinear coefficients can be calculated using , where is the speed of light in vacuum, is the equivalent nonlinear RI over the core area according to the expression provided in Ref. [28], and is the effective mode area. The effective areas of MG1 and MG2, calculated using the overlap integral of the spatial distribution of each MG, are approximately 21.3 and μ, respectively. The intermodal between the two MGs is around μ. Accordingly, the calculated nonlinear coefficient of MG1 is , and that of MG2 is , while the intermodal nonlinear coefficient between MG1 and MG2 is .
As seen in Fig. 2(b), the curve of the mode in MG1 intersects with each curve of the modes in MG2 at a specific wavelength. Going back to Fig. 1(b), we have at the intersecting wavelengths. In such conditions, if the pumps in both modes are placed at the same frequency such that , a signal at in mode can be converted to an idler at in mode or vice versa through the BS process, such that . Thus, our HNL-FMF can potentially be used for achieving mode exchange between the two MGs without requiring wavelength conversion. This is similar to the parametric wavelength exchange observed in single-mode fibers (SMFs) [29]. To experimentally observe this, however, a high conversion efficiency (CE) is required. The reason is that when dealing with multiple modes, cross talk from one mode to another is observed at the output, which is introduced by the mode-division multiplexer (MMUX) and demultiplexer (MDMUX) and linear mode coupling in the HNL-FMF. Thus, when both the signal and idler are at the same frequency and the CE is low, it would be difficult to differentiate between the generated idler in mode and the cross talk of the original signal in mode to mode . Unfortunately, due to the large insertion losses (ILs) of the MMUX/MDMUX used in this work, the CE of our system is not high enough to observe mode exchange. Nevertheless, we believe that by using other suitable MMUX/MDMUX systems such as photonic lanterns, which have much smaller ILs, this would be possible.
4. FIBER CHARACTERIZATION
Even though the simulations in the previous section provide an estimate of the dispersion and nonlinear properties of the fabricated HNL-FMF, exact characterization of the HNL-FMF is required in order to perform the FWM experiments. Thus, we have characterized the fabricated fiber to find the linear and nonlinear properties of the supported eigenmodes, namely, their attenuation coefficient , relative inverse group velocity , group velocity dispersion , and nonlinear coefficient .
We use two liquid crystal on silicon (LCoS) based spatial light modulators (SLMs) as the MMUX and MDMUX [30,31]. As shown in Fig. 3, by using a set of polarization diversity optics, the incoming beam from an SMF is split into two orthogonal polarizations. Each polarization is directed to a different area on the LCoS surface, making it possible to modulate the light in each polarization separately by displaying individual phase patterns on the area corresponding to each polarization. Another set of polarization diversity optics is used to recombine the two polarizations and focus the mode-multiplexed light into the HNL-FMF. The same configuration, but in the reverse direction, is used as the MDMUX at the output of the HNL-FMF, where an arbitrary spatial state with any polarization can be converted back into a Gaussian beam. To excite the eigenmodes within each MG, phase patterns of linearly polarized (LP) modes are displayed on the SLM. Each eigenmode in MG2 can be generated by combining different LP modes in orthogonal polarizations. For example, the phase pattern of in polarization and that of in polarization are used to generate mode (see Fig. 2 of Ref. [32] and Fig. 2 of Ref. [33] for more details). Note that the polarization state of the input beam should be 45° linearly polarized before the MMUX in order to have equal power in each polarization for the excitation of the eigenmodes in MG2. After properly aligning the system, the mode extinction ratio (power ratio at the MDMUX between the excited mode and all other modes) is more than 8 dB for both MG1 and MG2.
Figure 3.SLM apparatus when used as the MMUX for mode excitation of the fabricated HNL-FMF. PBS, polarizing beam splitter; , half-wave plate.
For intermodal FWM, since several input beams (pumps and signal) with different modes and wavelengths are interacting, an SMF array is used to combine these beams at the input of the MMUX. The fundamental mode in each input SMF can be individually converted to a desired mode of the HNL-FMF. The IL of the MMUX/MDMUX depends on the phase pattern displayed on the SLM and the number of ports used in the input SMF arrays.
A. Attenuation Coefficient
The attenuation coefficient of each MG is measured by using an optical time-domain reflectometer (OTDR). By changing the phase patterns displayed on the MMUX, we can selectively excite an MG and measure its attenuation. Since the modes within one MG couple linearly, we measure the losses of each MG instead of the individual modes. An optical pulse at 1550 nm, with a width of 100 ns, is generated by an OTDR. After propagating through a 300 m SMF, it travels through the MMUX, where it is converted to a specific MG. The pulse in the desired MG then propagates through the 2 km HNL-FMF and is converted back to the fundamental mode after the MDMUX. The backscattered power in each MG is measured by the OTDR and shown in Fig. 4 as a function of the propagation distance. The first 300 m relatively flat stage corresponds to the SMF before the MMUX, while the subsequent stage from 300 to 2300 m corresponds to the 2 km HNL-FMF under test. The two peaks in each curve correspond to the Fresnel reflections of the fiber ends in the SLMs of the MMUX and MDMUX. The Fresnel reflection creates blind zones right after the peak locations, due to the high reflected power. Thus, for better accuracy, the data measured far away from the Fresnel reflections should be considered for the loss calculations (i.e., the data located in the linear regime around 1.3 to 2.3 km). By fitting a linear curve to these measurements, we obtain attenuation coefficients of 0.59 and 0.65 dB/km for the MG1 and MG2, respectively. Since our HNL-FMF is the sample fabricated with the traditional standard SMF process, a low loss characteristic is possible if both the doping and drawing schemes are further optimized.
The SMF before the MMUX helps us measure the IL of the MMUX for each MG. By fitting a linear curve to the SMF stage and comparing its power level to that of the HNL-FMF stage at 300 m (where the MMUX is located), one can find the IL of the MMUX, which is 8.3 dB when exciting MG1 and 10 dB for MG2. However, due to the relatively large IL of the MMUX used, the dead zone after the reflection point of MMUX is relatively large. The data selected for the purpose of the linear fitting can cause an error in the injected power of around 0.3 dB. The MMUX loss is required for calculating the input power to the FMF, which is particularly useful for characterizing the nonlinear coefficient of the HNL-FMF, as will be explained in Section 4.C.
B. Group Delay
As mentioned in Section 2, the phase matching in intermodal FWM processes strongly depends on the of the interacting modes. In this section, we characterize by measuring the differential mode group delay (DMGD) of the HNL-FMF. We perform this measurement based on the time-of-flight technique [34], using the setup shown in Fig. 5. Light coming from a tunable continuous-wave (CW) laser is modulated into pulse signals by a Mach–Zehnder intensity modulator (IM) with a pulse width of 100 ps and a repetition rate of 100 MHz generated by an arbitrary waveform generator (AWG). The modulated signal is adjusted by a polarization controller, and then amplified by an erbium-doped fiber amplifier (EDFA) and launched into the HNL-FMF. The pulse signals propagating in different modes of the HNL-FMF will experience different time delays; therefore, after the MDMUX, they arrive at the photodiode (PD) at different times. By tuning the laser and measuring the relative time delay between the different modes, we can calculate at different wavelengths. Moreover, the wavelength dependence of the DMGD can be used to find the group velocity dispersion of each mode by
Figure 5.Setup of time-domain pulse response measurement, where GSa/s stands for gigasamples per second.
The signal wavelength is swept over the C band, and the pulse response and DMGD are measured for different wavelengths. The measurements are normalized and plotted in the spectrogram, as shown in Fig. 6. Four approximately linear curves are clearly seen in this figure, of which the three parallel curves from top to bottom correspond to the three eigenmodes , , and in MG2, respectively, and the other curve corresponds to the mode. It can be observed that as predicted by simulations, the eigenmodes in MG2 are not degenerate and thus propagate through the HNL-FMF at different velocities. For any given wavelength, the vertical color distribution can be treated as the pulse response. Among the three parallel curves, there are some inhomogeneous areas colored in light blue, corresponding to the mode coupling between the eigenmodes in MG2. We can extract between any two modes and of each mode, at any wavelength over the C band, from this figure. The extracted of each mode is shown in the inset of Fig. 6. Like other FMFs for intermodal FWM [13,27], the fabricated HNL-FMF is in the anomalous dispersion regime over the C band.
Figure 6.Spectrogram of fiber pulse response over the C band. Inset: of each eigenmode over the C band.
It can be observed that the slopes of the curves for all guided modes in Fig. 6 are close to the simulations in Fig. 2(b), and the between any two eigenmodes in MG2 also generally agrees with the simulations. However, the between the mode in MG1 and any of the eigenmodes in MG2 has a positive shift of in comparison with the simulations. As shown in Fig. 2(c), even a 1% variation in the fiber core radius or parameter during the fabrication process leads to a shift of more than 200 ps/km in the between the MG1 and MG2, while it has a much less effect on the within MG2. In addition to fabrication imperfections, some inhomogeneous stress was imposed on the HNL-FMF during the fiber spooling, which could have caused microdeformation of the fiber. The stress slightly reduces the core radius and introduces a positive shift on the between MGs according to Fig. 2(c), which agrees with our measured result. There is also a relative shift of between any two arbitrary eigenmodes in MG2 compared to Fig. 2(b). We infer that this is due to the circular asymmetry of the core induced by random longitudinal fluctuations such as core noncircularity and the azimuthally inhomogeneous doping, as well as the macrobending during the fiber spooling [35].
The HNL-FMF presented here has some specific dispersion properties, making it suitable for various applications. First, the non-degenerate modes in MG2 give rise to three curves. Thus, a signal at any given wavelength in MG1 can be phase matched with three different modes in MG2 at three different wavelengths. The number of simultaneous phase-matched processes could be three times that of a commercial two-MG FMF that has degenerate modes in MG2 [8]. This property may have potential for wavelength multicasting in mode-division multiplexed transmission, because compared to the schemes of using FMFs with more guided MGs [13], our HNL-FMF not only has smaller , leading to larger , but also has more balanced parametric gain properties for all mode channels in MG2 to mitigate the mode-dependent gain/loss. Second, even though there is linear mode coupling within MG2, the different dispersion properties of the eigenmodes allow selective eigenmode amplification in MG2 through intermodal FWM. This is possible because only the power in the phase-matched eigenmode will be amplified. Third, the three curves in MG2 are almost parallel over the C band, indicating that the intermodal BS processes between the eigenmodes in MG2 can be achieved with a relatively large bandwidth [10], which is from 7.7 to 18.7 nm in numerical simulations (considering a 10 dB bandwidth) depending on the selection of two interacting eigenmodes, leading to the potential application of broadband mode and wavelength conversion. Finally, the curve has intersections with the and curves in the C band. Hence, mode exchange becomes possible if the pumps and signal are placed near any of the crossing areas [29].
C. Nonlinear Coefficient
In order to measure the nonlinear coefficient and nonlinear RI for both MGs, we send two pumps with a small wavelength difference to the designated MG and measure the power of the idlers generated by cascaded FWM processes [36]. The measurement setup is presented in Fig. 7. Optical signals coming from two CW lasers, operating around 1550 nm with a wavelength difference of 0.2 nm, are aligned in polarization and combined by a 50∶50 polarization-maintaining (PM) coupler. After optical amplification, the signals are launched into a specific MG of the HNL-FMF. Optical interference occurs between the two optical waves, so the optical signal oscillates at a beat frequency of 25 GHz. If we treat the two pumps as a beat signal, the interaction process can be approximated as a self-phase modulation (SPM)-like process, because the wavelength difference of the pumps is small enough to neglect chromatic dispersion. As the beat signal propagates through the fiber, it experiences a nonlinear phase shift, which can be treated as a result of SPM determined by , where is the effective length of the fiber under test and is the average input power of both wavelengths. The signal is then demultiplexed and observed by an optical spectrum analyzer (OSA) with a wavelength resolution of 0.01 nm. The optical spectrum displays peaks at multiplies of the beat frequency if the nonlinear phase shift is large enough [24]. By measuring the power ratio between the peaks, it is possible to find and deduce the values of and [36]. The zero- and first-order harmonics of each MG are displayed in Fig. 8, from which we can obtain the nonlinear phase shift of the two MGs, as shown in the inset of Fig. 8.
Figure 7.Setup of CW-SPM nonlinear coefficient measurement.
Figure 8.SPM spectra of the beating signal after propagation in different MGs. Inset: relationship between the SPM phase shift and the power ratio of the zero- and first-order harmonics, according to Ref. [36]. The two markers in the inset correspond to the power ratios of MGs labeled in the main figure.
According to the IL measured in Section 4.A, is calculated and consequently for each individual MG is determined. The nonlinear coefficient of MG1 and MG2 is 5.7 and , respectively, indicating a nonlinear RI of . The measured results are close to , obtained from the analytical expression given in Ref. [28]. The eigenmodes in MG2 have very similar spatial distributions, so it is reasonable to consider a single value for all modes of MG2. The intermodal is estimated to be , based on the measured and the estimated intermodal .
5. INTERMODAL FOUR-WAVE MIXING
Based on the parameters characterized in the previous sections, we conducted an experiment to achieve simultaneous intermodal FWM among multiple eigenmodes of the HNL-FMF. The experimental setup is shown in Fig. 9. Pump 1 and the signal are in the mode, at 1550 and 1549.6 nm, respectively. Pump 2 is launched into the mode at 1542.3 nm, and Pump 3 in the mode is at 1565 nm. The wavelengths of the interacting waves are chosen based on the group delay properties of the modes, as shown in Fig. 6, so that the intermodal FWM processes are phase matched. The polarization controllers right after the Pump 1 and signal lasers are used to align the polarization of the two beams. A PM 90:10 coupler is used to couple Pump 1 and the signal into a high-gain EDFA, whose output power is set to be 28.5 dBm. A thin-film tunable optical bandpass filter (TBPF) with a bandwidth of 1 nm is used after the EDFA to filter out the amplified spontaneous emission noise. For Pump 2 and Pump 3, the bandwidths of the TBPFs are chosen to be 0.6 nm to ensure a good optical signal-to-noise ratio around each idler wavelength. Note that the polarization states of Pump 2 and Pump 3 before the MMUX should be linearly polarized with an azimuth of 45°, as described in Section 4. However, Pump 1 does not need to be co-polarized with Pump 2 and Pump 3, because the and modes are vector eigenmodes with a variable polarization state at an arbitrary spacial location, as shown in the inset of Fig. 2(a). For an arbitrary azimuth of the linearly polarized mode, the co-polarized component and cross-polarized component of the intermodal FWM exist side by side, and the total efficiency is always the same due to the symmetric spatial evolution of the polarization states. After the polarization states of all the input beams are aligned using three polarization controllers, they are combined together using an SMF array and launched into the MMUX, where each beam is converted to the desired eigenmode. After few-mode transmission over the 2 km HNL-FMF, mode-division demultiplexing is accomplished and the output spectrum is observed by an OSA.
Figure 9.Experimental setup for intermodal FWM. Signal and Pump 1 are connected with the port of the MMUX, while Pump 2 and Pump 3 are connected with the port and port, respectively.
It is noteworthy that there is a large loss in each mode channel between the EDFA output power and the power coupled into the corresponding mode in the HNL-FMF. The loss consists of ILs of all the connectors, the TBPF, and mainly the MMUX. By implementing the OTDR measurements, we obtained total losses of 10.7, 12.8, and 12.6 dB for the , , and modes, respectively. Thus, the actual power of Pump 1 injected into the mode at the HNL-FMF input is only 17.3 dBm, while the pump powers of the mode and mode are 6.2 and 15.9 dBm, respectively, since the EDFA output power for the mode is only 19 dBm. Under this power level of less than 100 mW, no geometric parametric instability effect can be stimulated over the 2 km HNL-FMF. Furthermore, the higher-order dispersion can be neglected in the analysis for the intermodal FWM experiment [22]. The Raman noise can also be neglected by considering the pump power and the small wavelength detuning between the signal and Pump 1 [37].
Figure 10 shows the output spectra in each MG. The spectrum of the output mode is intentionally redshifted by 0.1 nm for ease of observation, so that the spectra related to the two MGs do not overlap. For wavelengths near 1550 nm, we can clearly see intramodal MI idlers at 1550.4 and 1549.2 nm in the mode. The cross talk to MG2 (shown in red) shows a mode extinction ratio of at least 8 dB. For the mode at 1565 nm, the wavelength CE, which is defined as the power ratio between the output idler and the output signal, is and for the BS and PC processes, respectively. For the mode with a lower input power, CE is and for BS and PC, respectively. The generated idler power is proportional to the input pump power, and therefore the CE in the mode is higher than that of the mode. Due to the existence of random birefringence fluctuations, the output idler power in each eigenmode in MG2 is reduced [38]. Moreover, there is also cross talk among the eigenmodes in MG2 due to the mode coupling. However, the cross talk of the pump from one specific eigenmode to another eigenmode is not phase matched with respect to Pump 1 and the signal. Therefore, no idlers due to the cross talk will be generated, and consequently the idler power coupled into other eigenmodes will not be amplified. Moreover, the mode coupling within MG2 only causes a reduction of the idler power in the designated eigenmode and the deterioration of CE. Furthermore, we observe that all the idlers have power fluctuations within 5 dB, which is also due to the random mode coupling among the involved modes. This random reduction of the idler power in the designated eigenmode is the main limitation of using the non-degenerate eigenmodes. In addition, a small mechanical vibration or thermal variation can affect the value of and consequently lead to power fluctuations in the idlers [39]. Nevertheless, higher CE can be achieved if MMUX/MDMUX devices with smaller ILs (such as photonic lanterns) are used, or if higher-power EDFAs are used together with a stimulated Brillouin scattering suppression scheme. Using a longer HNL-FMF is also helpful for CE improvement. Furthermore, if the signal carries data, both BS and PC idlers of each eigenmode will carry the data (or phase-conjugated data). The mode could also be used as another mode channel for performing intermodal FWM over the L band, as can be deduced from Fig. 6. Thus, this HNL-FMF has the potential to achieve one to six intermodal wavelength multicasting within only two MGs.
Figure 10.Output spectra after mode demultiplexing. Two different MGs are received separately by changing the corresponding phase pattern in the MDMUX. For easier observation, a redshift of 0.1 nm is intentionally added on the spectrum when receiving the mode. Dashed lines indicate the cross talk from one MG to the other.
By changing the signal wavelength, the bandwidths of BS and PC between the and modes are investigated in Fig. 11. The signal to Pump 1 wavelength detuning is varied from 0.4 to 4 nm, with a 0.2 nm interval. As shown in Fig. 11, the blue peaks to the left of the Pump 2 wavelength correspond to the idlers of BS, while the red peaks to the right of Pump 2 are the idlers of PC. Taking the 10 dB bandwidth into consideration, the bandwidths of the BS and PC processes are 2.2 and 1.2 nm, respectively. The bandwidth of BS is larger than PC, in agreement with theoretical predictions [10]. We also simulated these nonlinear processes by numerically solving the coupled nonlinear Schrödinger equations that describe the propagation of the eigenmodes in the HNL-FMF [7]. The simulated bandwidths for the BS and PC processes are 1.7 and 0.8 nm, respectively, as shown in Fig. 11. The bandwidth difference between simulation and experiment may be due to the fluctuations of along the HNL-FMF induced by random local perturbations, especially for our HNL-FMF with a small core radius [38]. There is a trade-off between the fiber length and the bandwidth of the intermodal processes. Given the SLM losses, we needed a long fiber length to observe the intermodal nonlinearities. However, by using other MMUX/MDMUX methods, it is possible to shorten the fiber and increase the bandwidth of the BS and PC interactions.
Figure 11.Spectra of conversion efficiency when the signal wavelength varies from 1549.6 to 1546 nm. The blue curves correspond to the BS idlers, while the orange curves correspond to the PC idlers. The dashed-dotted curves correspond to the CE curves found through simulations, and the black dashed line shows where Pump 2 is located.
Design, fabrication, and characterization of an HNL-FMF is presented, with a record-high intermodal nonlinear coefficient of . The high germanium concentration in the core breaks the mode degeneracy in the second MG and results in different dispersion properties for the eigenmodes within that MG. This allows multiple intermodal interactions among the eigenmodes. The number of possible intermodal FWM processes between the two MGs is 3 times that of a commercial two-MG FMF, and in addition, intermodal FWM within MG2 can also be realized in the HNL-FMF presented here. Accordingly, simultaneous wavelength conversion among three eigenmodes is experimentally verified over the C band, which shows the great potential of this HNL-FMF in all-optical signal processing applications, such as wavelength multicasting and eigenmode conversion. According to the simulations, and consequently the phase matching of the intermodal FWM processes between the MGs are sensitive to fabrication imperfections, which should be taken into account while fabricating such fibers.
[3] C. Koebele, M. Salsi, L. Milord, R. Ryf, C. Bolle, P. Sillard, S. Bigo, G. Charlet. 40 km transmission of five mode division multiplexed data streams at 100 Gb/s with low MIMO-DSP complexity. 37th European Conference and Exhibition on Optical Communication, Th.13.C.3(2011).
[5] N. Zhao, B. Huang, R. Amezcua-Correa, X. Li, G. Li. Few-mode fiber optical parametric amplifier. Optical Fiber Communication Conference/National Fiber Optic Engineers Conference, OTu2D.5(2013).
[14] G. Rademacher, R. Ryf, N. K. Fontaine, H. Chen, R. M. Jopson, R. Essiambre, B. J. Puttnam, R. S. Luís, Y. Awaji, N. Wada, S. Gross, N. Riesen, M. Withford, Y. Sun, R. Lingle. Experimental investigation of parametric mode and wavelength conversion in a 4.7 km few-mode fiber. European Conference on Optical Communication (ECOC), 1(2018).
[27] G. Rademacher, R. S. Luís, B. J. Puttnam, Y. Awaji, M. Suzuki, T. Hasegawa, N. Wada. Wide-band intermodal wavelength conversion in a dispersion engineered highly nonlinear FMF. Optical Fiber Communication Conference (OFC), W1C.4(2019).
Jitao Gao, Elham Nazemosadat, Chen Yang, Songnian Fu, Ming Tang, Weijun Tong, Joel Carpenter, Jochen Schröder, Magnus Karlsson, Peter A. Andrekson, "Design, fabrication, and characterization of a highly nonlinear few-mode fiber," Photonics Res. 7, 1354 (2019)