
Yujin Yao, Huiling Tai, Dongsheng Wang, Yadong Jiang, Zhen Yuan, Yonghao Zheng. One-pot preparation and applications of self-healing, self-adhesive PAA-PDMS elastomers[J]. Journal of Semiconductors, 2019, 40(11): 112602
- Journal of Semiconductors
- Vol. 40, Issue 11, 112602 (2019)
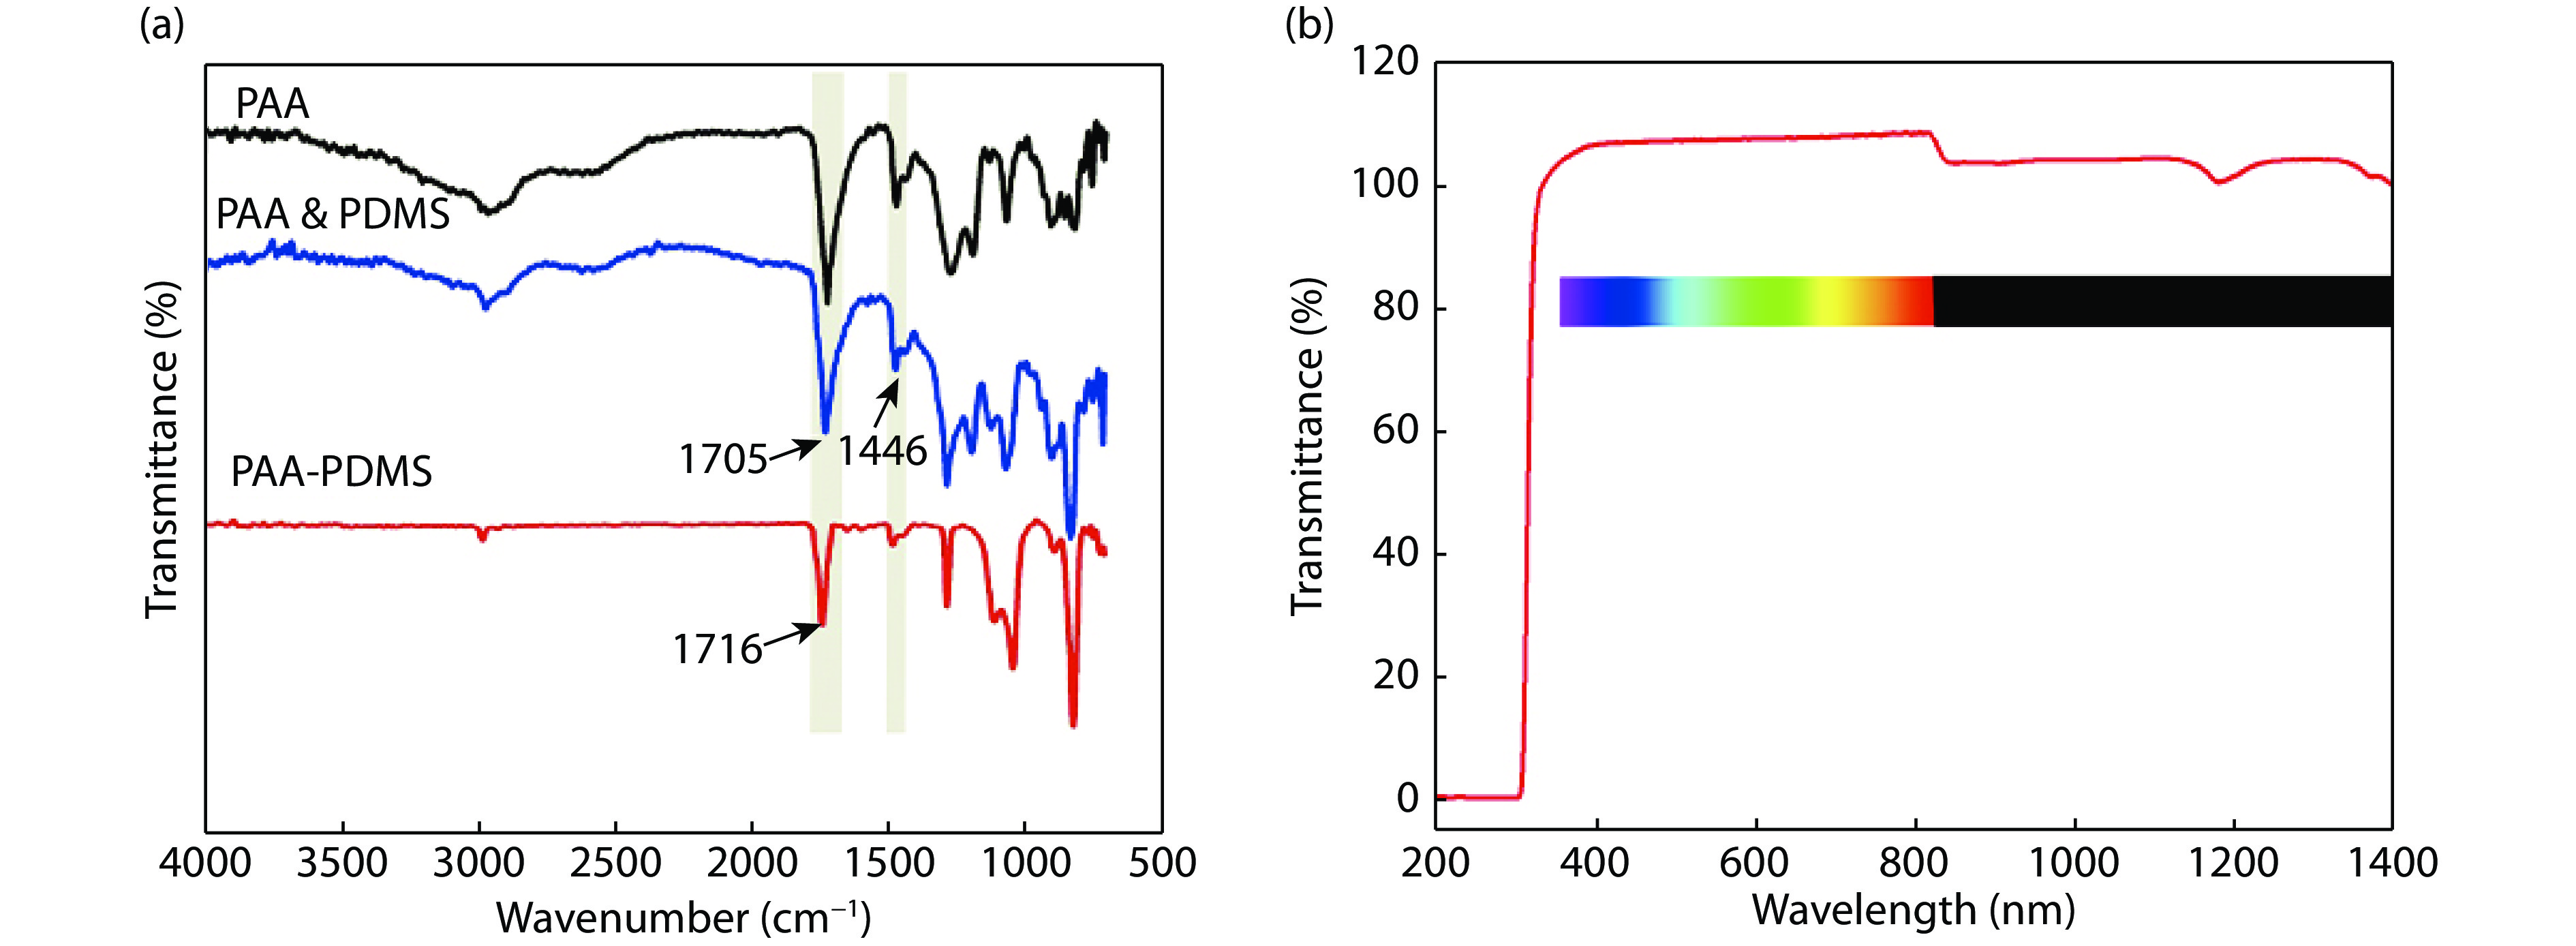
Fig. 1. (Color online) (a) ATR-FTIR and (b) UV spectra of neat PAA, PAA & PDMS and PAA-PDMS materials.
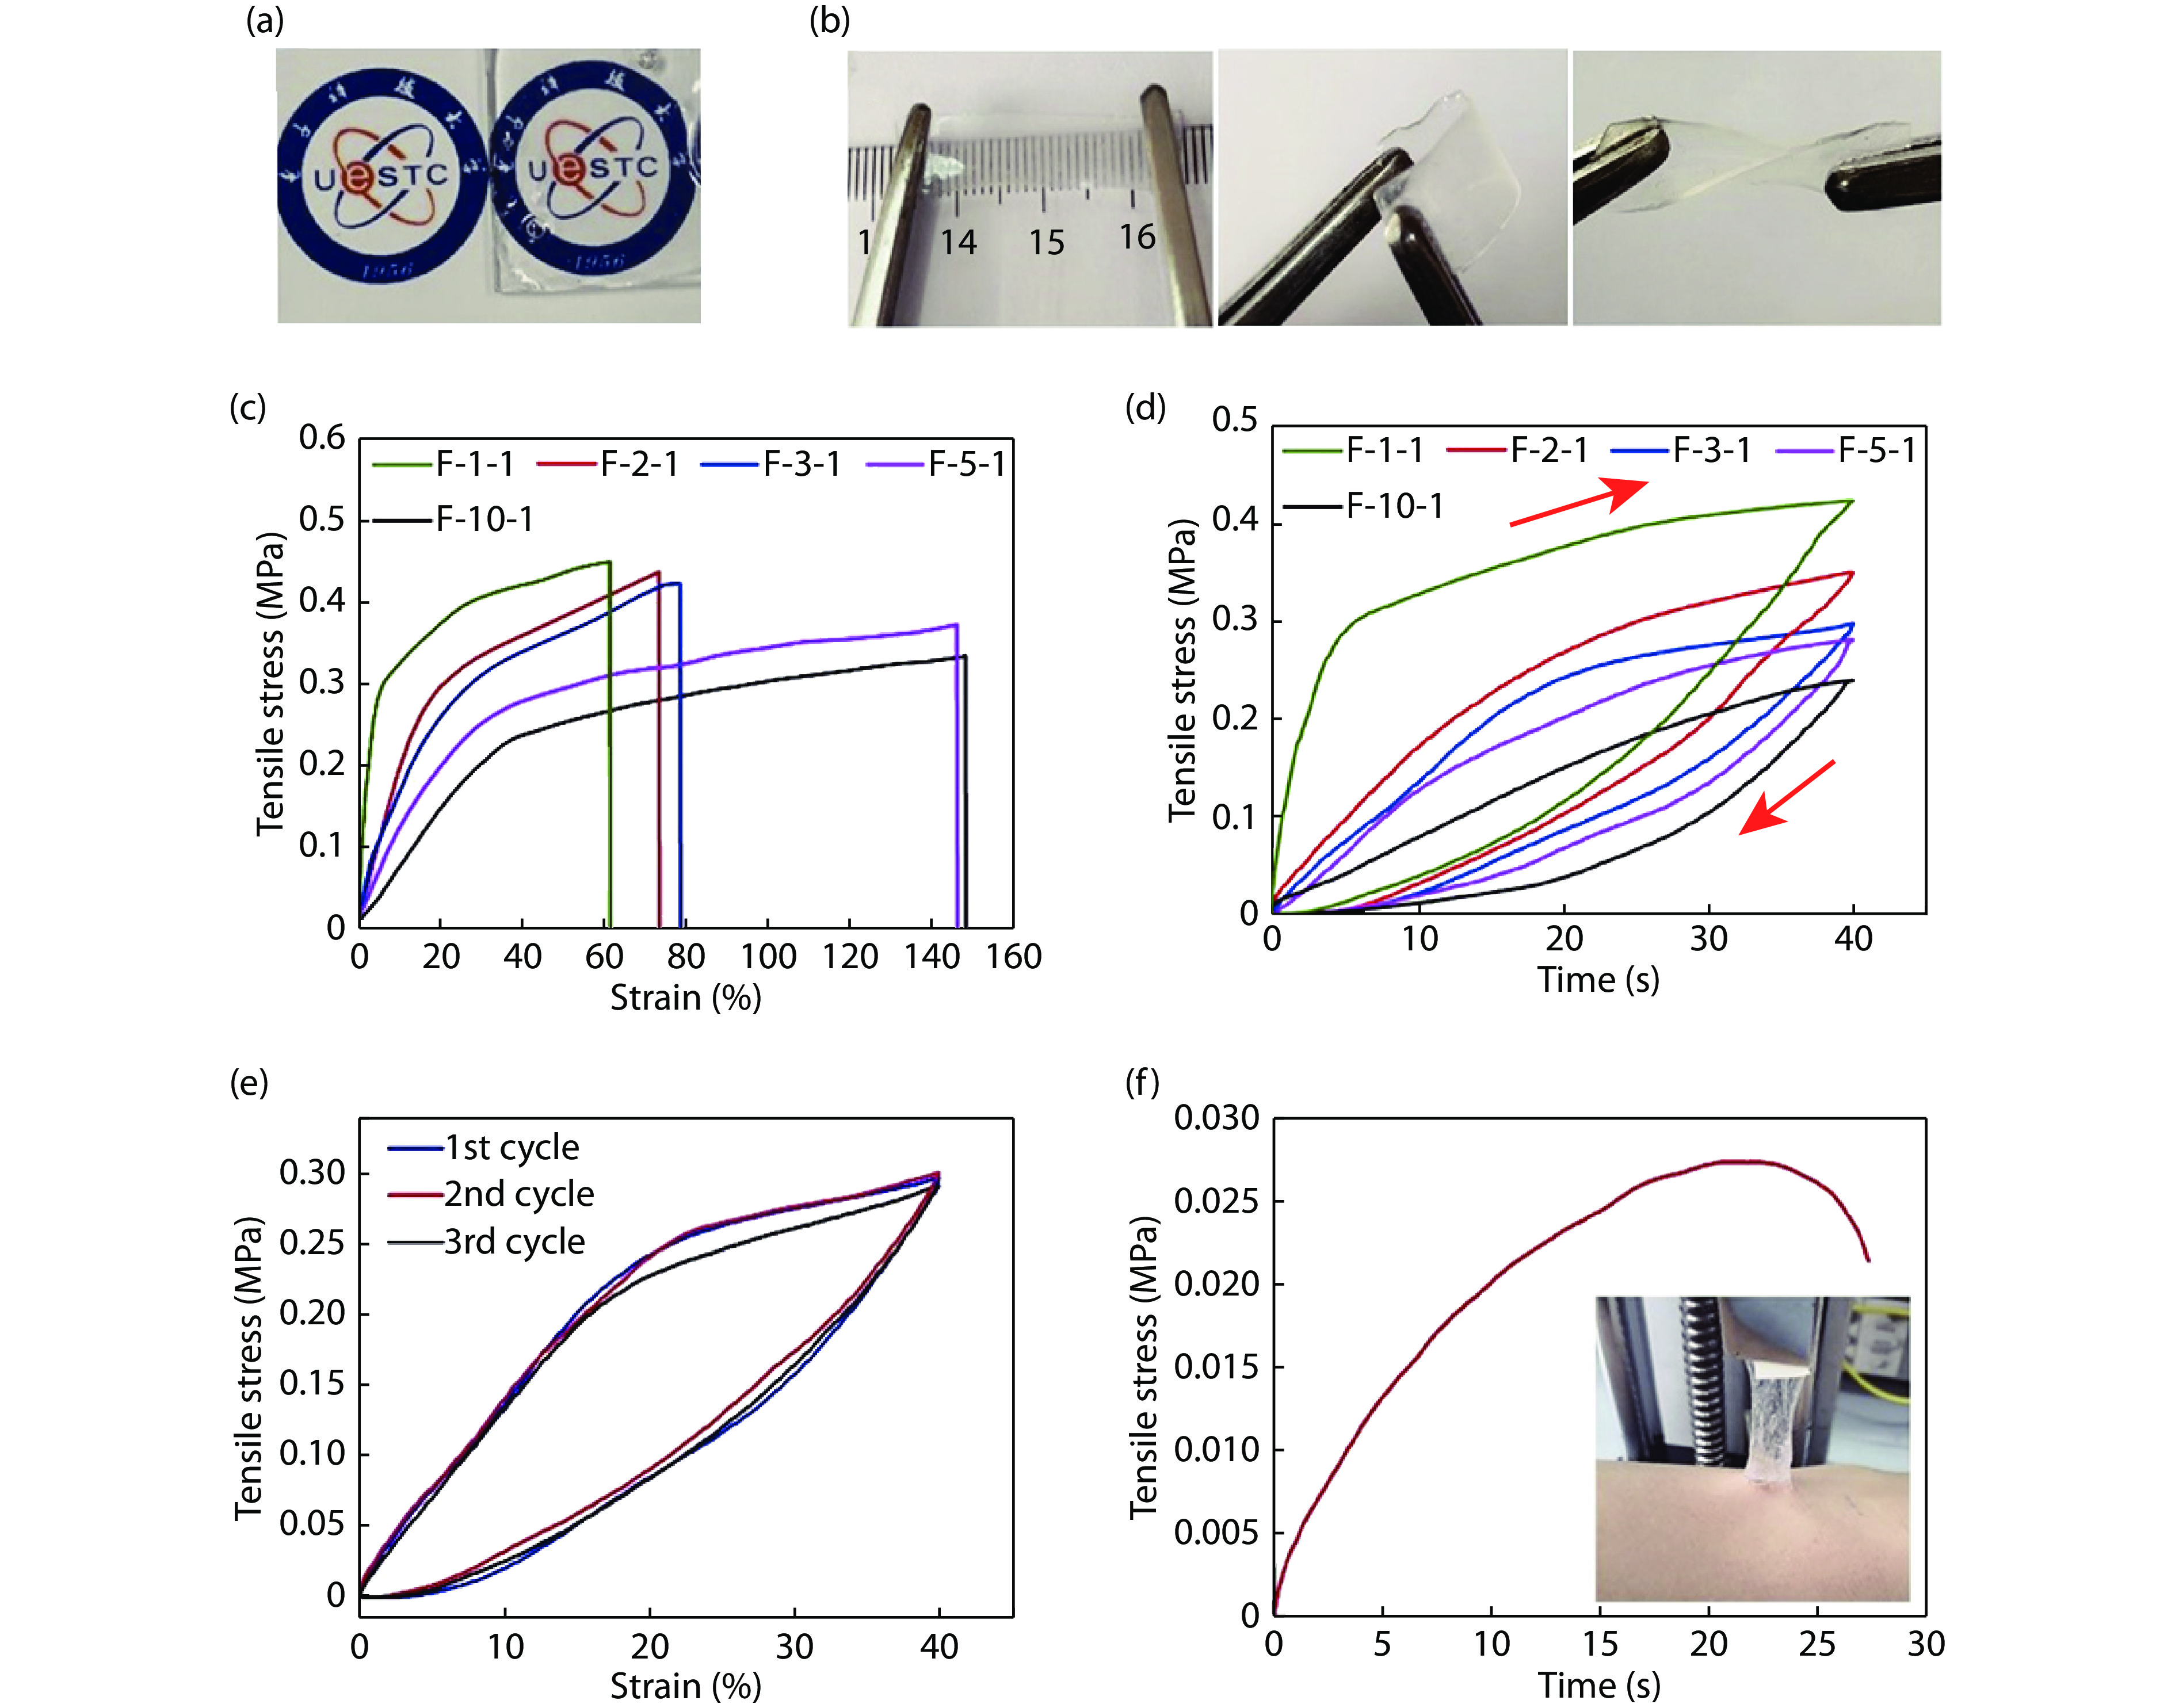
Fig. 2. (Color online) Physical properties of PAA-PDMS elastomers. (a) Photographic image of the transparent PAA-PDMS elastomer film. (b) Photographic images of PAA-PDMS films under stretching, bending, and twisting. (c) Typical tensile stress-strain curves of films with various weight ratios between PAA and PDMS-OH (F-1-1, F-2-1, F-3-1, F-5-1, and F-10-1). (d) and (e) Tensile stress-strain curves of PAA-PDMS films within 40% strain under loading-unloading cycle. (f) Tensile stress between PAA-PDMS elastomer and skin. Insert photo shows adhesion strength test of the PAA-PDMS elastomer on skin.
Fig. 3. (Color online) Self-healing properties of PAA-PDMS elastomers. (a) Photographic images of self-healing process of F-3-1 film, the healed film is mechanically stable under stretching. Typical tensile stress-strain curves for (b) F-2-1, (c) F-3-1 and (d) F-5-1 film during three cutting-healing cycles. (e) Self-healing efficiencies of PAA-PDMS elastomer films of F-2-1, F-3-1, and F-5-1 during three cutting-healing cycles.
Fig. 4. (Color online) OM and SEM images of healed PAA-PDMS elastomer. (a) OM images of the self-healing process of F-3-1 without any external stimulus. (b) SEM images of the self-healing process (surface cut) of F-3-1 under vapor treating, the process is finished in ~3 min.
Fig. 5. (Color online) Schematic illustrations of the self-healing process of PAA-PDMS elastomers.
Fig. 6. (Color online) The fabrication, electrical and mechanical properties of PAA-PDMS/PEI-rGO sensors. (a) Schematic illustration of preparing PAA-PDMS/PEI-rGO sensors. (b) Variations of tensile performance of the PAA-PDMS/PEI-rGO sensor vs. applied strain. (c) The response of the self-healing strain sensors under various applied tensile strains after 500 stretching/releasing cycles under 3% applied strain.
Fig. 7. (Color online) Application of PAA-PDMS/PEI-rGO strain sensors: the corresponding response to the (a–c) wrist and (d–f) press of the pristine, surface cut healed and complete cut healed strain sensors.
|
Table 1. Mechanical properties of elastomer with different ratios of PAA and PDMS-OH.


Set citation alerts for the article
Please enter your email address

© Copyright 2018-2021 | Chinese Laser Press. All Rights Reserved 沪ICP备15018463号-20