• Matter and Radiation at Extremes
  • Vol. 6, Issue 6, 068202 (2021)
Lingping Konga) and Gang Liu
Author Affiliations
  • Center for High Pressure Science and Technology Advanced Research, Shanghai 201203, China
  • show less
    DOI: 10.1063/5.0071856 Cite this Article
    Lingping Kong, Gang Liu. Synchrotron-based infrared microspectroscopy under high pressure: An introduction[J]. Matter and Radiation at Extremes, 2021, 6(6): 068202 Copy Citation Text show less
    Ranges of IR spectroscopy and the characteristic frequencies of various phenomena. Reprinted with permission from Okamura et al., Jpn. J. Appl. Phys., Part 1 56(5S3), 05FA11 (2017). Copyright 2017 IOP Publishing.
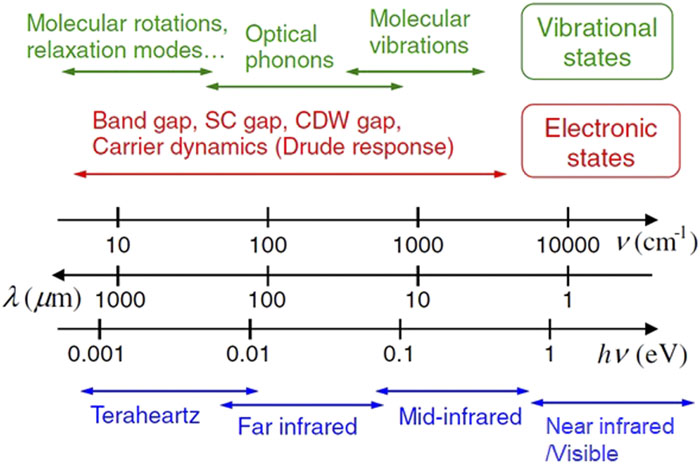
    Fig. 1. Ranges of IR spectroscopy and the characteristic frequencies of various phenomena. Reprinted with permission from Okamura et al., Jpn. J. Appl. Phys., Part 1 56(5S3), 05FA11 (2017). Copyright 2017 IOP Publishing.
    Dependence of IR intensity on microscope aperture size for Globar and synchrotron sources at the Hefei Light Source, National Synchrotron Radiation Laboratory, China. The beam current is 360 mA. The spectra were collected in the mid-IR range of 600–4000 cm−1. Reprinted with permission from Hu et al., Infrared Phys. Technol. 105, 103200 (2020). Copyright 2020 Elsevier B.V.
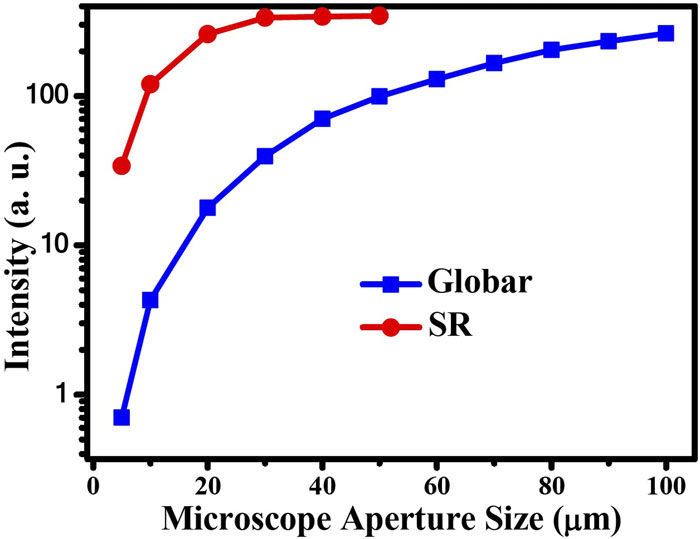
    Fig. 2. Dependence of IR intensity on microscope aperture size for Globar and synchrotron sources at the Hefei Light Source, National Synchrotron Radiation Laboratory, China. The beam current is 360 mA. The spectra were collected in the mid-IR range of 600–4000 cm−1. Reprinted with permission from Hu et al., Infrared Phys. Technol. 105, 103200 (2020). Copyright 2020 Elsevier B.V.
    Performance of various detectors. Reprinted from dataset of Bruker Corporation, “Application Note AN M161.” Copyright 2019 Author(s).39
    Fig. 3. Performance of various detectors. Reprinted from dataset of Bruker Corporation, “Application Note AN M161.” Copyright 2019 Author(s).39
    Design and performance of the high-pressure SIRMS station at BL01, SSRF. (a) Optical layout. (b) IR beam intensity at an averaged wavenumber of 5000 cm−1. An objective lens with a ×15 magnification (NA = 0.3) was used. (c) Raman spectra of D2 measured using this facility. Reprinted with permission from A. F. Goncharov, L. Kong, and H. K. Mao, Rev. Sci. Instrum. 90(9), 093905 (2019). Copyright 2019 AIP Publishing LLC.
    Fig. 4. Design and performance of the high-pressure SIRMS station at BL01, SSRF. (a) Optical layout. (b) IR beam intensity at an averaged wavenumber of 5000 cm−1. An objective lens with a ×15 magnification (NA = 0.3) was used. (c) Raman spectra of D2 measured using this facility. Reprinted with permission from A. F. Goncharov, L. Kong, and H. K. Mao, Rev. Sci. Instrum. 90(9), 093905 (2019). Copyright 2019 AIP Publishing LLC.
    IR transmittance spectra of various types of diamond anvils. Reprinted with permission from Okamura et al., Jpn. J. Appl. Phys., Part 1 56(5S3), 05FA11 (2017). Copyright 2017 IOP Publishing.
    Fig. 5. IR transmittance spectra of various types of diamond anvils. Reprinted with permission from Okamura et al., Jpn. J. Appl. Phys., Part 1 56(5S3), 05FA11 (2017). Copyright 2017 IOP Publishing.
    Pressure dependence of intermolecular coupling represented by the difference between the IR and Raman vibron frequencies up to 280 GPa. Reprinted with permission from Goncharov et al., Proc. Natl. Acad. Sci. U. S. A. 116(51), 25512–25515 (2019). Copyright 2019 National Academy of Sciences.
    Fig. 6. Pressure dependence of intermolecular coupling represented by the difference between the IR and Raman vibron frequencies up to 280 GPa. Reprinted with permission from Goncharov et al., Proc. Natl. Acad. Sci. U. S. A. 116(51), 25512–25515 (2019). Copyright 2019 National Academy of Sciences.
    Selected absorption spectra of hydrogen at high pressure and low temperature. The shaded areas are regions of absorption from diamond anvils at low energy, and the blue curves are representative optical conductivities derived from the simple Drude model. The left inset shows the pressure–temperature phase diagram of hydrogen, where the highlighted area is the region of study. The right inset shows the visible absorption spectra at selected pressures and temperatures. Reprinted with permission from C.-S. Zha, Z. Liu, and R. J. Hemley, Phys. Rev. Lett. 108(14), 146402 (2012). Copyright 2012 American Physical Society.
    Fig. 7. Selected absorption spectra of hydrogen at high pressure and low temperature. The shaded areas are regions of absorption from diamond anvils at low energy, and the blue curves are representative optical conductivities derived from the simple Drude model. The left inset shows the pressure–temperature phase diagram of hydrogen, where the highlighted area is the region of study. The right inset shows the visible absorption spectra at selected pressures and temperatures. Reprinted with permission from C.-S. Zha, Z. Liu, and R. J. Hemley, Phys. Rev. Lett. 108(14), 146402 (2012). Copyright 2012 American Physical Society.
    (a) Selected absorption spectra of hydrogen at high pressures up to 427 GPa. The arrows denote the magnitude of the bandgap. (b) Pressure dependence of bandgap from experiments and calculations. Reprinted with permission from P. Loubeyre, F. Occelli, and P. Dumas, Nature 577(7792), 631–635 (2020). Copyright 2020 Springer Nature Limited.
    Fig. 8. (a) Selected absorption spectra of hydrogen at high pressures up to 427 GPa. The arrows denote the magnitude of the bandgap. (b) Pressure dependence of bandgap from experiments and calculations. Reprinted with permission from P. Loubeyre, F. Occelli, and P. Dumas, Nature 577(7792), 631–635 (2020). Copyright 2020 Springer Nature Limited.
    (a) Selected absorption spectra of nitrogen at high pressures from 80 to 170 GPa at room temperature. (b) High-pressure lattice modes found above the phase transition pressures. Reprinted with permission from Goncharov et al., Phys. Rev. Lett. 85(6), 1262–1265 (2000). Copyright 2000 American Physical Society.
    Fig. 9. (a) Selected absorption spectra of nitrogen at high pressures from 80 to 170 GPa at room temperature. (b) High-pressure lattice modes found above the phase transition pressures. Reprinted with permission from Goncharov et al., Phys. Rev. Lett. 85(6), 1262–1265 (2000). Copyright 2000 American Physical Society.
    (a) Calculated reflectivity ratios Rs/Rn of H3S in the two superconducting states (at 50 and 150 K) compared with the normal metal state at 200 K. (b) Superconducting gap measurement. (c) Bosonic structure study showing an agreement between theoretical and experimental results and demonstrating an electron–phonon interaction mechanism. (d) Strong absorption due to IR-active phonons. Reprinted with permission from Capitani et al., Nat. Phys. 13(9), 859–863 (2017). Copyright 2017 Springer Nature Limited.
    Fig. 10. (a) Calculated reflectivity ratios Rs/Rn of H3S in the two superconducting states (at 50 and 150 K) compared with the normal metal state at 200 K. (b) Superconducting gap measurement. (c) Bosonic structure study showing an agreement between theoretical and experimental results and demonstrating an electron–phonon interaction mechanism. (d) Strong absorption due to IR-active phonons. Reprinted with permission from Capitani et al., Nat. Phys. 13(9), 859–863 (2017). Copyright 2017 Springer Nature Limited.
    IR absorption spectra of pure CO2, pure ZIF-8, and ZIF-8 loaded with CO2 at mild pressures of the order of 0.78–1.0 GPa. The left inset shows the zoomed spectral region of 3500–3800 cm−1. The right inset shows a photograph of ZIF-8 loaded with CO2. Reprinted with permission from Hu et al., J. Am. Chem. Soc. 135(25), 9287–9290 (2013). Copyright 2013 American Chemical Society.
    Fig. 11. IR absorption spectra of pure CO2, pure ZIF-8, and ZIF-8 loaded with CO2 at mild pressures of the order of 0.78–1.0 GPa. The left inset shows the zoomed spectral region of 3500–3800 cm−1. The right inset shows a photograph of ZIF-8 loaded with CO2. Reprinted with permission from Hu et al., J. Am. Chem. Soc. 135(25), 9287–9290 (2013). Copyright 2013 American Chemical Society.
    Pressure dependence of frequencies for four mid-IR modes. Pressure-driven IR peak shifts are distinguished between low-pressure and high-pressure phase ranges. Red and blue open squares represent the peak positions of the IR modes measured in the low-pressure range corresponding to the I4/mcm phase and in the high-pressure range corresponding to the Imm2 phase, respectively. Gray dashed lines indicate the approximate phase boundaries. Red dashed and blue dashed lines are guides to the eyes for redshifts and blueshifts. Reprinted with permission from Kong et al., Proc. Natl. Acad. Sci. U. S. A. 113(32), 8910–8915 (2016). Copyright 2016 National Academy of Sciences.
    Fig. 12. Pressure dependence of frequencies for four mid-IR modes. Pressure-driven IR peak shifts are distinguished between low-pressure and high-pressure phase ranges. Red and blue open squares represent the peak positions of the IR modes measured in the low-pressure range corresponding to the I4/mcm phase and in the high-pressure range corresponding to the Imm2 phase, respectively. Gray dashed lines indicate the approximate phase boundaries. Red dashed and blue dashed lines are guides to the eyes for redshifts and blueshifts. Reprinted with permission from Kong et al., Proc. Natl. Acad. Sci. U. S. A. 113(32), 8910–8915 (2016). Copyright 2016 National Academy of Sciences.
    Pressure-induced metallization in methylammonium lead iodide perovskite: (a) and (b) CH3NH3PbI3; (c) and (d) CD3ND3PbI3. In (d), the blue-shaded region indicates the pressures where metallization of CH3NH3PbI3 takes place. (a) and (b) Reprinted with permission from Jaffe et al., J. Am. Chem. Soc. 139(12), 4330–4333 (2017). Copyright 2017 American Chemical Society. (c) and (d) Reprinted with permission from Kong et al., Adv. Funct. Mater. 31(9), 2009131 (2021). Copyright 2021 John Wiley & Sons, Inc.
    Fig. 13. Pressure-induced metallization in methylammonium lead iodide perovskite: (a) and (b) CH3NH3PbI3; (c) and (d) CD3ND3PbI3. In (d), the blue-shaded region indicates the pressures where metallization of CH3NH3PbI3 takes place. (a) and (b) Reprinted with permission from Jaffe et al., J. Am. Chem. Soc. 139(12), 4330–4333 (2017). Copyright 2017 American Chemical Society. (c) and (d) Reprinted with permission from Kong et al., Adv. Funct. Mater. 31(9), 2009131 (2021). Copyright 2021 John Wiley & Sons, Inc.
    (a) Synchrotron IR absorption and (b) TEM characterizations of hydrous ringwoodite sample recovered from 30 GPa. In (a), spectrum 1 refers to the detected location in the unheated part of the crystal. The other locations 2 and 3 were laser-heated at 1600 °C. Reprinted with permission from Schmandt et al., Science 344(6189), 1265–1268 (2014). Copyright 2014 American Association for the Advancement of Science.
    Fig. 14. (a) Synchrotron IR absorption and (b) TEM characterizations of hydrous ringwoodite sample recovered from 30 GPa. In (a), spectrum 1 refers to the detected location in the unheated part of the crystal. The other locations 2 and 3 were laser-heated at 1600 °C. Reprinted with permission from Schmandt et al., Science 344(6189), 1265–1268 (2014). Copyright 2014 American Association for the Advancement of Science.
    Beam splitterSpectral range (cm−1)
    KBr (broadband)10 000–380
    CaF2-NIR15 500–1200
    Quartz-VIS25 000–8000
    Quartz-UV/VIS/NIR55 000–4000
    Mylar 23 μm-FAR120–30
    Mylar 50 μm-FAR60–8
    Mylar 125 μm-FAR25–5
    Table 1. Various beam splitters covering different spectral ranges.
    SynchrotronBeamlineE (GeV)I (mA)Collection angles (H × V, mrad)IR sourceaSpectral range (cm−1)Temperature rangebYear
    ALS (USA)1.4.1.450040 × 10BM200–11 0007–400 K (development)1997
    SPring-8 (Japan)BL43IR810036.5 × 12.6BM100–8 0004.2–400 K/83–873 K2001
    Bessy II (Germany)IRIS1.910060 × 30BM30–20 0001.6–500 K2001
    ELETTRA (Italy)BL9.12–2.4150–32065 × 25BM100–visible80 K–RT2004
    Australian (AS)IR320058 × 17ER+BMTHz–visible2006
    CLS (Canada)Mid-IR2.930055 × 37BM560–6 000RT2006
    Far-IR5–1 000
    SOLEIL (France)SMIS2.7550078 × 20ER+BM10–8 0005 K–RT2006
    AILES
    Diamond (UK)B22350055 × 30ER+BM5–10 00077–873 K2007
    SESAME (Jordan)IR2.540039 × 15ER+BM50–12 500RT2012
    SSRF (China)BL01B3.530040 × 20ER600–10 0004.2 K–RT2013
    PAL (Korea)12D IRS2.5–3.040066 × 18ER+BM200–7 000RT2016
    ALBA (Spain)BL01340043 × 25.17ER+BM100–10 000RT2016
    HLSII (China)U40.836060 × 55BM20–8 0005–5002016
    SSRF (China)BL06B3.530040 × 20ER10–12 8004.2 K–RT2020
    Table 2. Parameters of IR beamlines worldwide.
    Diamond typeImpurities
    Type IaANitrogen atom pair
    Type IaBGroup of four nitrogen atoms with lattice vacancy
    Type IbSingle nitrogen atom
    Type IIaNo nitrogen or boron atom
    Type IIbBoron atom
    Table 3. Diamond types.
    Lingping Kong, Gang Liu. Synchrotron-based infrared microspectroscopy under high pressure: An introduction[J]. Matter and Radiation at Extremes, 2021, 6(6): 068202
    Download Citation