• Chinese Optics Letters
  • Vol. 16, Issue 5, 050003 (2018)
Jing Yan1、2, Yinghui Guo1、2, Mingbo Pu1、2, Xiong Li1、2, Xiaoliang Ma1、2, and Xiangang Luo1、2、*
Author Affiliations
  • 1State Key Laboratory of Optical Technologies on Nano-Fabrication and Micro-Engineering, Institute of Optics and Electronics, Chinese Academy of Sciences, Chengdu 610209, China
  • 2University of Chinese Academy of Sciences, Beijing 100049, China
  • show less
    DOI: 10.3788/COL201816.050003 Cite this Article Set citation alerts
    Jing Yan, Yinghui Guo, Mingbo Pu, Xiong Li, Xiaoliang Ma, Xiangang Luo. High-efficiency multi-wavelength metasurface with complete independent phase control[J]. Chinese Optics Letters, 2018, 16(5): 050003 Copy Citation Text show less
    Schematic of unit cell for the proposed metasurface. Left panel: 3D view of the basic element used in the simulation. Right panel: view of the top and bottom metallic layer (top panel) as well as the middle metallic layer (bottom panel).
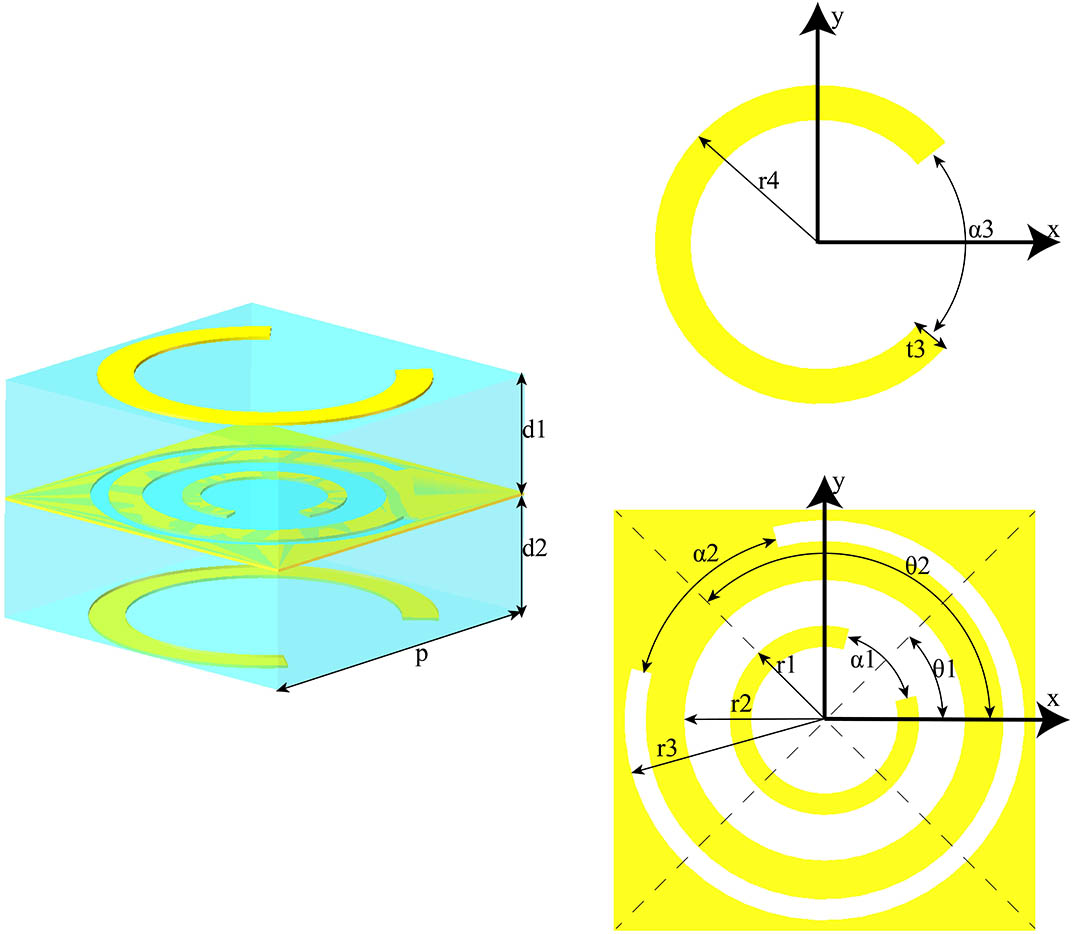
    Fig. 1. Schematic of unit cell for the proposed metasurface. Left panel: 3D view of the basic element used in the simulation. Right panel: view of the top and bottom metallic layer (top panel) as well as the middle metallic layer (bottom panel).
    Simulated results of the twelve-level unit cells. (a) and (c) illustrate the phase response and transmission amplitude at 10 GHz under y-polarized incidence, respectively. (b) and (d) illustrate the phase response and transmission amplitude at 20 GHz under x-polarized incidence, respectively. (e) The polarization conversion ratio at 10 GHz under y-polarized incidence. (f) The polarization conversion ratio at 20 GHz under x-polarized incidence.
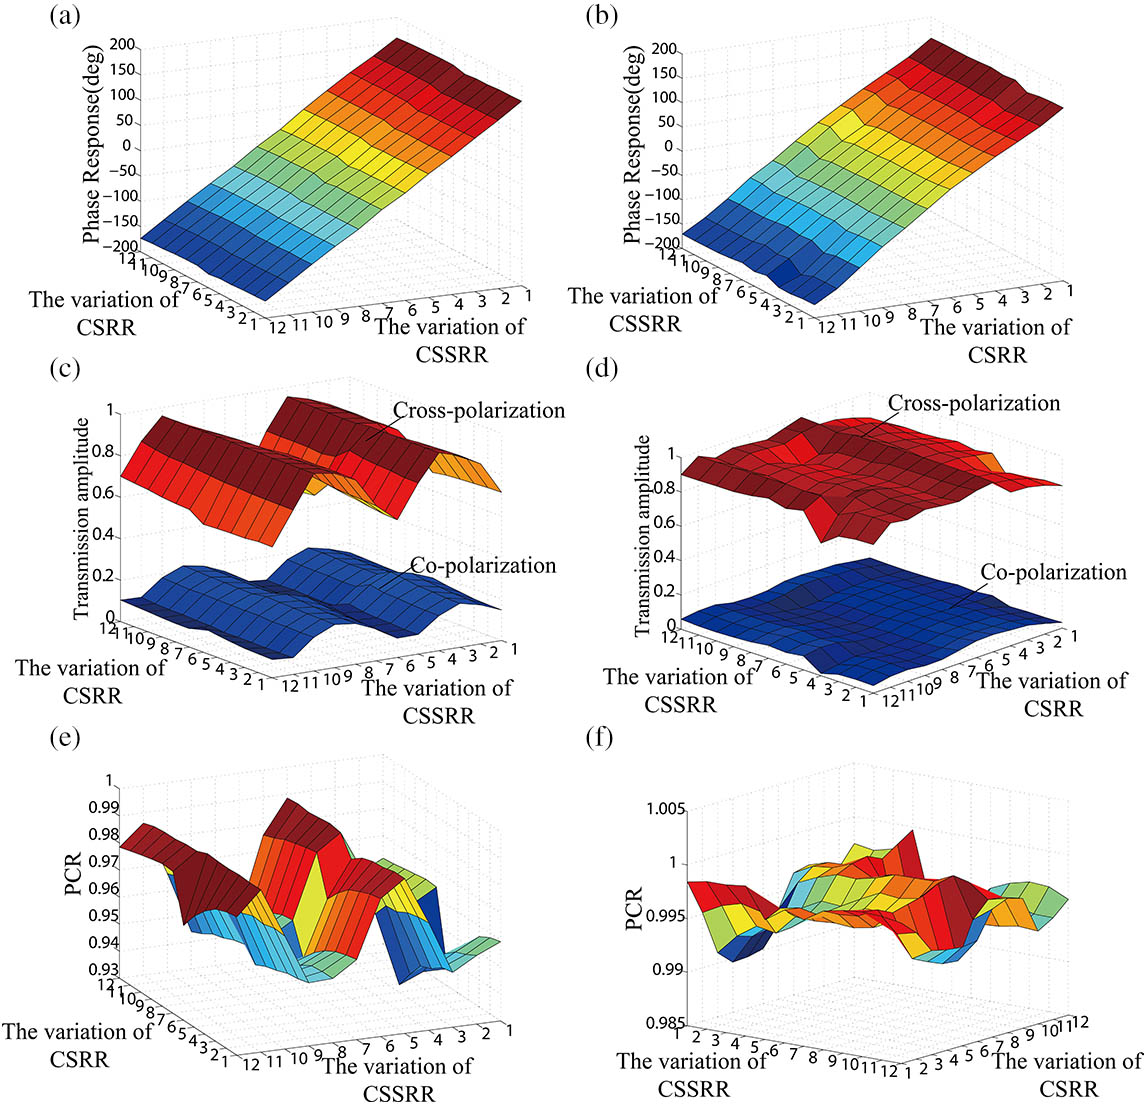
    Fig. 2. Simulated results of the twelve-level unit cells. (a) and (c) illustrate the phase response and transmission amplitude at 10 GHz under y-polarized incidence, respectively. (b) and (d) illustrate the phase response and transmission amplitude at 20 GHz under x-polarized incidence, respectively. (e) The polarization conversion ratio at 10 GHz under y-polarized incidence. (f) The polarization conversion ratio at 20 GHz under x-polarized incidence.
    (a) illustrates the transmission amplitude at 10 GHz under x-polarized incidence. (b) illustrates the transmission amplitude at 20 GHz under y-polarized incidence.
    Fig. 3. (a) illustrates the transmission amplitude at 10 GHz under x-polarized incidence. (b) illustrates the transmission amplitude at 20 GHz under y-polarized incidence.
    Simulated results of generated OAM. (a) and (b) illustrate the phase distribution for 10 and 20 GHz, respectively. (c) and (e) illustrate the intensity pattern and phase pattern of the electric-field distributions at the position of z = 50 mm under 10 GHz, respectively. (d) and (f) illustrate the intensity pattern and phase pattern of the electric-field distributions in near-field under 20 GHz at the position of z = 50 mm, respectively.
    Fig. 4. Simulated results of generated OAM. (a) and (b) illustrate the phase distribution for 10 and 20 GHz, respectively. (c) and (e) illustrate the intensity pattern and phase pattern of the electric-field distributions at the position of z=50mm under 10 GHz, respectively. (d) and (f) illustrate the intensity pattern and phase pattern of the electric-field distributions in near-field under 20 GHz at the position of z=50mm, respectively.
    Simulated results of deflector. (a) and (c) illustrate the simulated y component and x component of electric-field distribution under the x-polarized normal incidence at 20 GHz, respectively. (b) and (d) illustrate the simulated y component and x component of electric-field distribution under the x-polarized normal incidence at 20 GHz, respectively. (e) and (f) illustrate 3D far-field patterns under the x-polarized normal incidence at 10 and 20 GHz, respectively.
    Fig. 5. Simulated results of deflector. (a) and (c) illustrate the simulated y component and x component of electric-field distribution under the x-polarized normal incidence at 20 GHz, respectively. (b) and (d) illustrate the simulated y component and x component of electric-field distribution under the x-polarized normal incidence at 20 GHz, respectively. (e) and (f) illustrate 3D far-field patterns under the x-polarized normal incidence at 10 and 20 GHz, respectively.
    Simulated results of the deflector. (a) illustrates the phase shift under the x-polarized normal incidence from 18 to 24 GHz, and the curves of different colors correspond to the different cells. (b) illustrates the phase shift under the y-polarized normal incidence from 9 to 11 GHz. (c) and (e) illustrate the simulated y component of electric-field distribution under the x-polarized normal incidence at 19 and 24 GHz. (d) and (f) illustrate the simulated x component of electric-field distribution under the y-polarized normal incidence at 9 and 11 GHz.
    Fig. 6. Simulated results of the deflector. (a) illustrates the phase shift under the x-polarized normal incidence from 18 to 24 GHz, and the curves of different colors correspond to the different cells. (b) illustrates the phase shift under the y-polarized normal incidence from 9 to 11 GHz. (c) and (e) illustrate the simulated y component of electric-field distribution under the x-polarized normal incidence at 19 and 24 GHz. (d) and (f) illustrate the simulated x component of electric-field distribution under the y-polarized normal incidence at 9 and 11 GHz.
    Variation of CSSRRα2 (°)θ2 (°)Variation of CSRRα1 (°)θ1 (°)
    11651351200135
    21501352180135
    31201353155135
    4851354120135
    545135585135
    610135655135
    716545720045
    815045818045
    912045915545
    1085451012045
    114545118545
    121045125545
    Table 1. Opening Angle and Orientation of the Unit Cell
    Jing Yan, Yinghui Guo, Mingbo Pu, Xiong Li, Xiaoliang Ma, Xiangang Luo. High-efficiency multi-wavelength metasurface with complete independent phase control[J]. Chinese Optics Letters, 2018, 16(5): 050003
    Download Citation