• Spectroscopy and Spectral Analysis
  • Vol. 40, Issue 10, 3277 (2020)
Cai-xia JIAO1、1、*, Guang-hui ZHENG1、1, Xian-li XIE1、1, Xue-feng CUI1、1, and Gang SHANG1、1
Author Affiliations
  • 1[in Chinese]
  • 11. School of Geographic Sciences, Nanjing University of Information Science & Technology, Nanjing 210044, China
  • show less
    DOI: 10.3964/j.issn.1000-0593(2020)10-3277-05 Cite this Article
    Cai-xia JIAO, Guang-hui ZHENG, Xian-li XIE, Xue-feng CUI, Gang SHANG. Prediction of Soil Organic Matter Using Visible-Short Near-Infrared Imaging Spectroscopy[J]. Spectroscopy and Spectral Analysis, 2020, 40(10): 3277 Copy Citation Text show less
    Location of samples
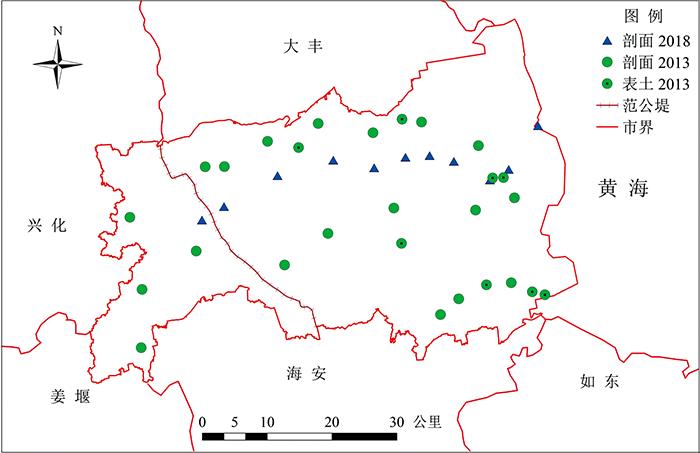
    Fig. 1. Location of samples
    Collection and preprocessing of imaging spectroscopy
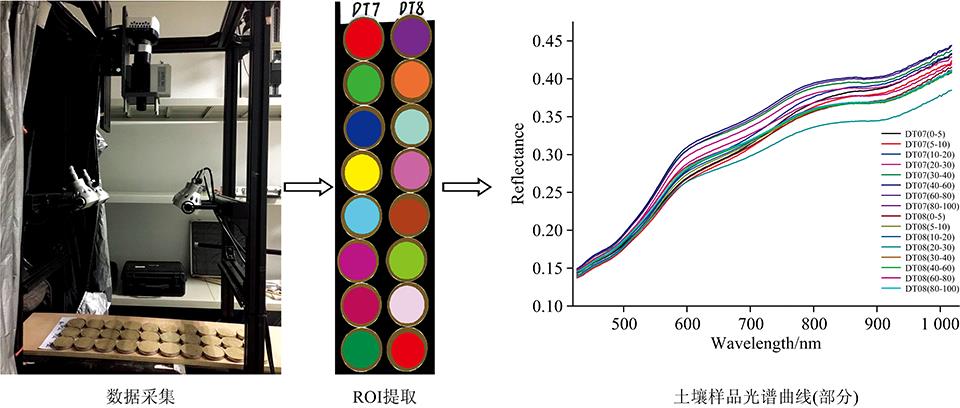
    Fig. 2. Collection and preprocessing of imaging spectroscopy
    Scatter plot of SOM and DOA
    Fig. 3. Scatter plot of SOM and DOA
    Relative frequency for determination coefficients of calibration and prediction
    Fig. 4. Relative frequency for determination coefficients of calibration and prediction
    NumberMin/(k·kg-1)Max/(k·kg-1)Mean/(k·kg-1)Std/(k·kg-1)CV/%
    全部样本2781.3952.568.727.6487.65
    堤东样本2361.3933.387.435.9980.63
    堤西样本422.4252.5615.9211.2270.46
    Table 1. Descriptive statistics of SOM content
    RMSEC/
    (k·kg-1)
    Rc2RMSEP/
    (k·kg-1)
    Rp2RPD
    Min4.100.284.460.021.02
    Max6.100.696.650.641.68
    Mean5.190.525.380.491.42
    Table 2. Statistics of DOA regression
    RMSEC/
    (k·kg-1)
    Rc2RMSEP/
    (k·kg-1)
    Rp2RPD
    Min2.990.284.090.071.04
    Max7.170.817.580.621.62
    Mean5.220.525.750.431.33
    Table 3. Statistics of partial least square regression
    Cai-xia JIAO, Guang-hui ZHENG, Xian-li XIE, Xue-feng CUI, Gang SHANG. Prediction of Soil Organic Matter Using Visible-Short Near-Infrared Imaging Spectroscopy[J]. Spectroscopy and Spectral Analysis, 2020, 40(10): 3277
    Download Citation