
Zixuan Wang, Yanjiao Hu, Ming Pang. Microstructure and Comprehensive Properties of Laser-Melted Stainless Steel[J]. Laser & Optoelectronics Progress, 2021, 58(19): 1914006
- Laser & Optoelectronics Progress
- Vol. 58, Issue 19, 1914006 (2021)
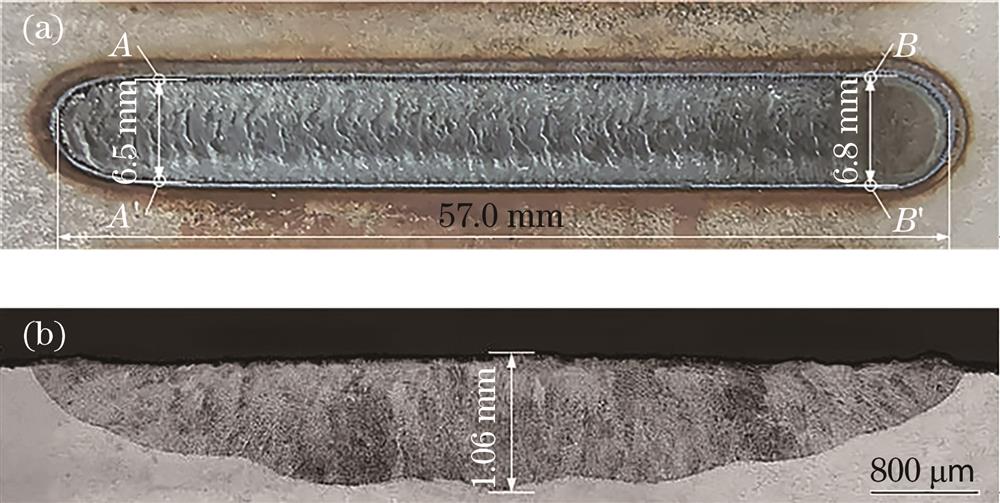
Fig. 1. Images of reinforced area. (a) Front image; (b) cross-sectional image
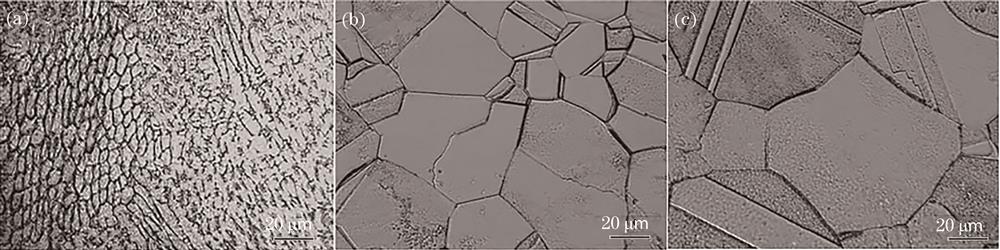
Fig. 2. Metallographic structures of different areas. (a) Strengthened area; (b) heat-affected zone; (c) matrix area
Fig. 3. SEM morphologies at different positions of strengthened zone. (a) Local morphology of strengthened zone; (b) position A, surface morphology of strengthened zone; (c) position B, morphology in the middle of strengthened zone; (d) position C, morphology of side edge of strengthened zone; (e) position D, morphology of bottom edge of strengthened zone
Fig. 4. Schematic of the line scanning direction of the energy spectrum in strengthened zone
Fig. 5. Spectral diagram of strengthened zone along the scanning direction
Fig. 6. Schematic of the position of microhardness testing points
Fig. 7. Microhardness curves of samples before and after laser strengthening
Fig. 8. Polarization curves of samples before and after laser strengthening
Fig. 9. Friction coefficient versus time for samples before and after laser strengthening
Fig. 10. SEM morphologies of samples before and after laser strengthening. (a) Before laser strengthening; (b) after laser strengthening
|
Table 1. Chemical composition of 0Cr17Ni12Mo2 steel
|
Table 2. Electrochemical corrosion related data of samples before and after laser strengthening

Set citation alerts for the article
Please enter your email address
© Copyright 2018-2021 | Chinese Laser Press. All Rights Reserved 沪ICP备15018463号-20