Wenqiang Hua, Guangzhao Zhou, Yuzhu Wang, Ping Zhou, Shumin Yang, Chuanqian Peng, Fenggang Bian, Xiuhong Li, Jie Wang, "Measurement of the spatial coherence of hard synchrotron radiation using a pencil beam," Chin. Opt. Lett. 15, 033401 (2017)
Copy Citation Text
We present a simple method to measure the spatial coherence of hard x-ray beams. Based on the convolution of Gaussian functions, we analyze the diffraction patterns of a grating irradiated by partially coherent hard x rays with a constrained beam diameter. The spatial coherence properties of an x-ray beam are obtained from the width of the diffraction peaks with high accuracy. The results of experiments conducted by combining a pinhole with a grating show a good agreement with our calculation using the Gaussian–Schell model.
Benefiting from the small source size and low emittance of third generation synchrotron radiation facilities and x-ray free electron lasers[1], high-brightness x-ray beams with a relatively high degree of spatial coherence provide the basis for promising coherent techniques such as coherent x-ray diffraction imaging (CDI)[2] and x-ray photon correlation spectroscopy[3]. These techniques strongly depend on the lateral coherence of quasi-monochromatic synchrotron x-ray beams. Therefore, it is necessary to measure the spatial coherence. Micrometric transverse coherence length is usually obtained by letting the beam propagate over a long distance and using upstream slits to collimate the beam at the sample position[4]. However, the transmission of x-ray beams through the optical elements of a beamline, such as monochromators and mirrors, will probably both lower the transverse coherence and distort the wavefront. Furthermore, detailed knowledge of coherence properties can be used to improve the resolution of CDI phase retrieval methods[5]. Thorough understanding of the spatial coherence properties of an x-ray beam is therefore important for coherent experiments and follow up data processing.
The spatial coherence of an x-ray beam emitted by a synchrotron source is normally characterized by the transverse coherence length or the coherent fraction of light. For the past two decades, multiple experimental techniques have been used to measure spatial coherence, including x-ray grating interferometry[6–8], phase-space tomography[9], intensity interferometry[10], and measurements that utilize scattering on Brownian particles[11]. One typical approach used to measure the optical spatial coherence is Young’s double-slit interferometry, where the visibility of interference fringes is directly related to the degree of coherence of an incident beam. Fringe visibility-based measurements have been successfully performed using diffraction/interference methods, like double-slit/pinhole interferometry[12–14], prism interferometry[15], single-slit/pinhole/fiber diffraction[4,16], and grating interferometry. Experimentally, although the diffraction fringe measurement of a pinhole is simple to perform, this approach suffers from multiple noise sources, for instance, upstream parasitic light and the rough edges of pinholes. This decreases the reliability of spatial coherence measurements using pinholes because the degree of coherence is theoretically sensitive to the fringe visibility. For a hard x-ray beam emanating from a third generation synchrotron facility, the transverse coherence length at sample positions typically has a magnitude of a few microns. This means that a pinhole diameter of several microns is generally required in coherent x-ray experiments and coherence length measurements. However, it is difficult to manufacture micron-sized pinholes that do not let in any parasitic light.
Gratings are widely used in the x-ray phase contrast and dark-field imaging methods[17–19], as well as the transverse coherence and wavefront measurements[20]. Almost all such measurements have been performed in the near-field diffraction region based on the Talbot self-imaging effect. Another grating-based technique characterizes hard x ray transverse coherence properties by estimating the intensity profile of a diffraction pattern in which the Gaussian–Schell model (GSM) is used in an iterative phase retrieval procedure[21]. Similarly, a uniformly redundant array[22] and a nonredundant array[23] have also been used to acquire spatial coherence by the deconvolution of measured diffraction patterns.
Sign up for Chinese Optics Letters TOC. Get the latest issue of Chinese Optics Letters delivered right to you!Sign up now
In this work, a novel method is proposed to measure the spatial coherence of hard x rays using a grating illuminated by a pencil beam in which the transverse coherence can be easily obtained from the width of the diffraction peaks of a grating with high accuracy instead of the diffraction intensity. Taking into account the blurring effect of partial coherence on the diffraction fringes of a grating, one may figure out the dependence of the peak width of diffraction fringes on the peak width of fully coherent diffraction fringes of a grating, transverse coherence length, and the interaction between adjacent peaks. If the Fraunhofer diffraction approximation is satisfied, the interaction between adjacent peaks can be omitted because diffraction peaks in the far-field region are sufficiently separated that their interaction is negligible. The distance dividing the Fresnel and Fraunhofer regions is known as the Rayleigh length[16]. Therefore, for a finite wave propagation distance, the Fraunhofer diffraction[24] can be obtained by using an incident pencil beam. For experimental validation, diffraction patterns of a grating behind a pinhole are recorded and the spatial coherence of hard x rays is estimated. In addition, there is little corruption of diffraction patterns despite strong parasitic scattering light from the pinhole. This is because only a tiny part of the parasitic light scatters at the same angles as the direct beam, according to the grating equation.
The far-field diffraction pattern of an object illuminated by partially coherent, monochromatic light could be described as[25]where is the diffraction intensity, is the Fourier transform of the complex degree of coherence of incident light, and is the diffraction pattern produced by a fully coherent incident light. The operator means the convolution of two functions.
The GSM is a reasonable approach to describe the spatial coherence of synchrotron radiation, because both the intensity and coherence distributions of synchrotron radiation are Gaussian functions[26–28]. Herein, is given by[25]where is a position coordinate in the observation plane transverse to the beam direction, is the root mean square (RMS) value of the Fourier transform of the complex coherence function (CCF), is the wavelength, is the sample-to-detector distance, and the transverse coherence length is defined as the RMS width of the CCF.
In this work, a grating was used as the sample and an incident pencil beam of diameter was obtained by placing a circular aperture in front of the grating. For hard X-ray small-angle scattering experiment, the diffraction angle is usually very small (). So, all small-angle far-field grating diffraction peaks possess nearly the same format of the pinhole diffraction pattern, which is described mathematically by , where is the Bessel function of the first kind of order unity and . Ignoring the relatively small outer rings of the diffraction pattern, a Gaussian profile of may be a good approximation for the central lobe, where for a circular aperture, or 0.375 for a rectangular aperture. By combining Eqs. (2) and (3) with Eq. (1), can be derived. Therefore, the value of an x-ray beam can be obtained if the RMS widths and are known. Correspondingly, the expansion ratio of the diffraction peaks caused by partial coherence of light is
As demonstrated in Ref. [4], the visibility of a diffraction profile is subject to a smearing effect when illuminated by partially coherent light, which gives
From Eqs. (5) and (6), the transverse coherence length is clearly related to the expansion ratio and the visibility of fringes. However, the fringe visibility could go to zero when decreases, and the low signal-to-noise ratio of visibility will lead to an inaccurate coherence measurement. In contrast, the expansion ratio will provide a more reliable coherence length with a higher accuracy when the value is reduced.
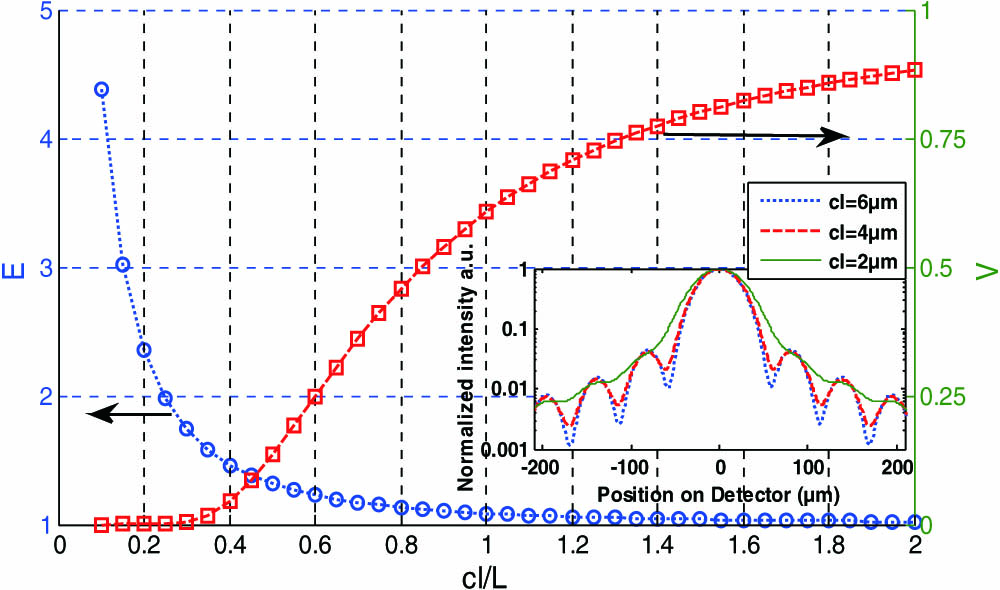
Using the parameters in Ref. [4], the expansion ratio and the visibility demonstrated with respect to were determined, as shown in Fig. 1. For one-dimensional diffraction of a slit, the contrast of fringes reduces with decreasing . When is sufficiently small, the fringe visibility is near zero, so the coherence measurements maybe not accurate for a low signal-to-noise ratio, which appear slow enough in simulated diffraction profiles with reducing as displayed in the inset of Fig. 1. In contrast, the width and expansion ratio of diffraction peaks increases with decreasing value, allowing for the coherence length of the incident beam to be obtained with higher accuracy.
Figure 1.Expansion ratio (blue circles) and visibility (red squares) plotted against the value obtained for the beam diameter μ, wavelength , and detector distance . (Inset) Normalized diffraction profiles displayed for various values.
The experiment was performed on BL19U2, which is an undulator beamline dedicated to biological small-angle x-ray scattering at the Shanghai Synchrotron Radiation Facility (SSRF), China[29,30]. A monochromatic beam of 12 keV was provided by a 1.6 m U20 undulator and Si(111) double-crystal monochromator (DCM). Downstream horizontal (at 31.2 m) and vertical (at 34 m) mirrors[31] focused the x-ray beam onto the detector plane. A secondary source slit at 41 m was used to cut the beam. All the optical elements before the experimental station operated under a high vacuum environment (vacuum degree ). A 13 μm pinhole (Zeiss) in a piece of platinum-iridium alloy sheet was located at 50 m, and a grating followed close behind. The experiment used a one-dimensional transmission grating with a period of 200 nm, a line width of 100 nm (Fig. 2), and an active area of about μμ considering the beam spot diameter of 13 μm. The grating was fabricated on a low-stress 100 nm membrane using lithography (Crestec CABL-9500C). An 80 nm thick Au layer was deposited by electron-beam evaporation after lithography. A Photonic Science X-ray 11 Megapixel VHR CCD camera ( pixels with an effective pixel size of μμ) was placed 5.9 m downstream from the pinhole to separate the diffraction peaks enough to allow detection by the CCD camera. To get low background data, a 5 m evacuated flight tube (sealed by kapton windows) was placed between the grating and the detector to reduce additional signals due to air scattering. A circular beamstop with a diameter of 8 mm was used to protect the CCD camera from damage.
Figure 2.Schematic diagram of the experimental setup at the SSRF BL19U2 beamline. The inset in the lower left corner is a scanning electron microscope image of the center portion of the grating.
Diffraction images were recorded under conditions that the grooves were oriented horizontally and vertically, respectively, and the secondary source slit had openings of μμ and μμ. With no polishing to the edges of the pinhole, light strayed by the rough edges appears more intensely than that diffracted by the grating, although the beamstop blocks much of it [Figs. 3(a,b) and 4(a,b)]. However, the diffraction peaks contain no detectable noise. By fitting normalized intensity profiles of the second- and third-order diffraction peaks with Gaussian functions [Figs. 3(c) and 4(c)], the grating diffraction peaks’ widths were obtained. Further taking into account the CCD’s point spread function, the peaks’ widths need to be deconvolved by the CCD’s pixel size, and then the values of the measured single aperture diffraction profile were found (Table 1). The spatial coherence lengths, expansion ratios, and visibilities listed in Table 1 were calculated using Eqs. (4)–(6) with the experimental parameters , μ, and . The visibility is so low that it hardly displays any fringe fluctuation, so it is difficult to precisely derive the spatial coherence length. Meanwhile, the expansion ratio is large enough that we can make the approximation based on Eqs. (4) and (5). Therefore, the accuracy of the coherence measurement is correspondingly increased because plays only a small role in the convolution calculation of the diffraction fringe. Furthermore, high flux in the measurements will shorten the data acquisition time compared with that of normal coherence measurements based on pinhole diffraction because of the small value.
Horizontal
Vertical
Secondary source slit size (μm)
100
200
100
200
σcoh (μm)
20.45
σm (μm)
34.87
49.77
28.87
35.41
σFμ (μm)
28.23
45.38
20.38
28.91
Expansion ratio
1.71
2.43
1.41
1.73
Visibility
7.79×10⁻⁴
9.50×10⁻⁹
2.41×10⁻²
5.54×10⁻⁴
cl (μm)
3.44
2.14
4.76
3.36
Table 1. Measured Beam Parameters of BL19U2 With a 13 μm Pinhole, Grating Period of 200 nm, Photon Energy of 12 keV, and Secondary Source Slit Sizes of 100 μm×100 μm and 200 μm×200 μm
Figure 3.Measured diffraction patterns obtained with a secondary source slit size of (a) μμ and (b) μμ for a horizontally placed grating. (c) The normalized intensity profiles for the second- and third-order diffraction peaks of the gratings along the horizontal direction.
Figure 4.Measured diffraction patterns obtained with a secondary source slit size of (a) μμ and (b) μμ for a vertically placed grating. (c) The normalized intensity profiles for the second- and third-order diffraction peaks of the gratings along the vertical direction.
Coherence calculations based on the GSM for 12 keV x rays of BL19U2 were conducted to verify the experimental results (Table 2). The calculations demonstrated that the spatial coherence length deduced from the measurement is similar to the simulated results in the horizontal direction. However, the measured spatial coherence length in the vertical direction is smaller than that calculated using the GSM. These deviations are usually to blame for imperfections of the optical elements in the beamline. As demonstrated in Ref. [20], the measured transverse coherence length for the channel-cut monochromator is about twice that for the DCM in the vertical direction at the ESRF ID01 beamline. This difference was attributed to the vibrations and instabilities existing in the DCM setup caused by the heat load on the first crystal. As also recognized by Ref. [32], the roughness and vibration on the mirror and monochromator surfaces degraded the downstream beam’s transverse coherence.
Horizontal
Vertical
Beam size at the source 0 m (μm)
154
9.79
Transverse coherence length at the source (μm)
0.47
1.24
Beam size at the KB mirror (μm)
1073
at 31.2 m
434
at 34 m
Transverse coherence length at the KB mirror (μm)
3.249
55.4
Degree of coherence
0.0015
0.0637
Beam size at the secondary source slit 41 m (μm)
656
296
Transverse coherence length at secondary source slit (μm)
1.99
37.8
Secondary source slit size (μm)
100
200
100
200
Beam size at the sample 50 m (μm)
74.3
80.4
17.4
33.0
Transverse coherence length at the sample (μm)
3.48
1.89
15.6
15.2
Degree of coherence after secondary source slit
0.023
0.012
0.409
0.225
Table 2. Simulated Beam Parameters of BL19U2 Along the Beamline Using the GSM for a Photon Energy of 12 keV
The coherent x-ray science has been troubled by the “decoherence” phenomenon for many years. The x-ray experiment is not a truly closed system and some time-varying external interactions will contribute to the optical systems that will lead to irreversible degradation of spatial coherence. The external influences may include the cryogenic-cooled system on the monochromator, the instability of the electric mechanism such as a piezoelectric motor, foundation instability, etc. Second, the surface imperfection of the optical elements will surely produce speckle patterns when illuminated with coherent light and the short x-ray wavelength will make these speckles unresolvable in many cases. An ensemble averaging process of the unresolvable speckles simulates the degradation of coherence. In this work, the DCM at BL19U2 was placed horizontally, and the heat load on the crystals was removed with a cryogenic-cooled system. In consideration of these external influences and the surface roughness problems, the discrepancy of the spatial coherence length between the measured and simulated results in the vertical direction is understandable because of the possible imperfections in the monochromator and various optical elements[33] in the beamline.
In conclusion, a simple method to measure the spatial coherence of hard x rays is developed. This method depends on the far-field Fraunhofer diffraction of a grating and the expansion ratio of diffraction peaks instead of the near-field diffraction of grating diffraction used in other available coherence measurements. According to optics, Fraunhofer fringes may be realized by confining an incident beam or observing at a far enough location. The expansion effect of Fraunhofer fringes is a function of partial coherence, which in the case of synchrotron radiation can be simply described using a form of the Pythagorean theorem. As a result, transverse coherence can be obtained from the widths of the measured diffraction peaks of a grating with a high accuracy and reliability. Good agreement between measurements and calculations based on the GSM in the horizontal direction verifies the accuracy and reliability of this method, although there is some discrepancy between experimental and simulated results in the vertical direction. An advantage of the developed technique is that the influence of imperfections of the instrumentation on measurements is minimized. Furthermore, the theoretical analysis of the expansion effect is also expected to be useful for coherent x-ray experiments and coherence characterization of low-brilliance, high-energy x-ray sources despite their short coherence length and numerous distractions.
Wenqiang Hua, Guangzhao Zhou, Yuzhu Wang, Ping Zhou, Shumin Yang, Chuanqian Peng, Fenggang Bian, Xiuhong Li, Jie Wang, "Measurement of the spatial coherence of hard synchrotron radiation using a pencil beam," Chin. Opt. Lett. 15, 033401 (2017)