
Renjie Jiang, Zhiwei Cheng, Qiang Wu, Rongshi Xiao. Research on Al/Cu Laser Brazing-Fusion Process Based on Wire Deep Penetration Mode[J]. Chinese Journal of Lasers, 2021, 48(22): 2202013
- Chinese Journal of Lasers
- Vol. 48, Issue 22, 2202013 (2021)
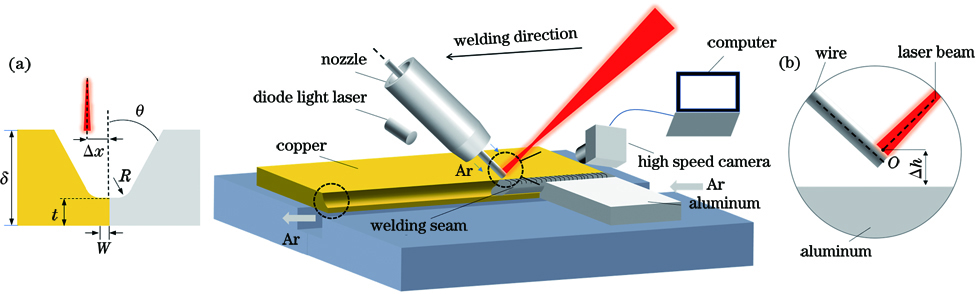
Fig. 1. Layout of test device. (a) Groove size; (b) action point position between laser beam and wire
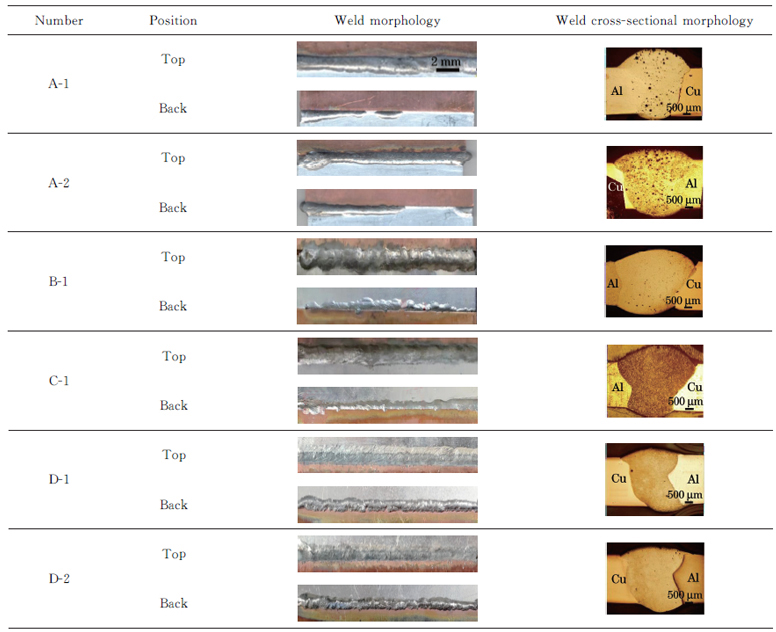
Fig. 2. Weld morphologies and weld cross-sectional morphologies
Fig. 3. Influences of Δh on weld formation
Fig. 4. Weld morphologies. (a) Metallographic diagram of weld cross section; (b) upper part of interface layer; (c) middle part of interface layer; (d) lower part of interface layer; (e) weld center area
Fig. 5. Surface scan results of elements. (a) Magnified view of interface layer; (b) distribution of Al element; (c) distribution of Si element; (d) distribution of Cu element
Fig. 6. X-ray diffraction analysis pattern in weld
Fig. 7. Microhardness distributions of joints
Fig. 8. Tensile strength of joints
Fig. 9. SEM images of tensile fractures. (a) Without grinding; (b) with grinding
| |||||||||||||||||||||||||||||||||||||||||||||||||||||||||||||||||||||||||||||||||||||||||||||||||||||
Table 1. Specific size parameters of different grooves
|
Table 2. Welding parameters
|
Table 3. EDS results in weld
|
Table 4. EDS results of joint fracture areas


Set citation alerts for the article
Please enter your email address

© Copyright 2018-2021 | Chinese Laser Press. All Rights Reserved 沪ICP备15018463号-20