• Chinese Journal of Lasers
  • Vol. 49, Issue 1, 0101019 (2022)
Mengmeng Tao1、2、**, Xisheng Ye1、*, Jingfeng Ye2, Ting Yu1, Zhao Quan1, Yunfeng Qi1, Guobin Feng2, and Weibiao Chen1
Author Affiliations
  • 1Shaihai Key Laboratory of All Solid-State Laser and Applied Techniques, Shanghai Institute of Optics and Fine Mechanics, Chinese Academy of Sciences, Shanghai 201800, China
  • 2State Key Laboratory of Laser Interaction with Matter, Northwest Institute of Nuclear Technology, Xi’an, Shaanxi 710024, China
  • show less
    DOI: 10.3788/CJL202249.0101019 Cite this Article Set citation alerts
    Mengmeng Tao, Xisheng Ye, Jingfeng Ye, Ting Yu, Zhao Quan, Yunfeng Qi, Guobin Feng, Weibiao Chen. Modeling In-band Pumped kW Level High-Power Tm-Doped Fiber Lasers via Simulations[J]. Chinese Journal of Lasers, 2022, 49(1): 0101019 Copy Citation Text show less
    Distribution of the heat load for different laser systems at 1 kW output. (a) 793 nm cladding pump; (b) 1570 nm cladding pump; (c) 1910 nm core pump; (d) 1910 nm pedestal pump
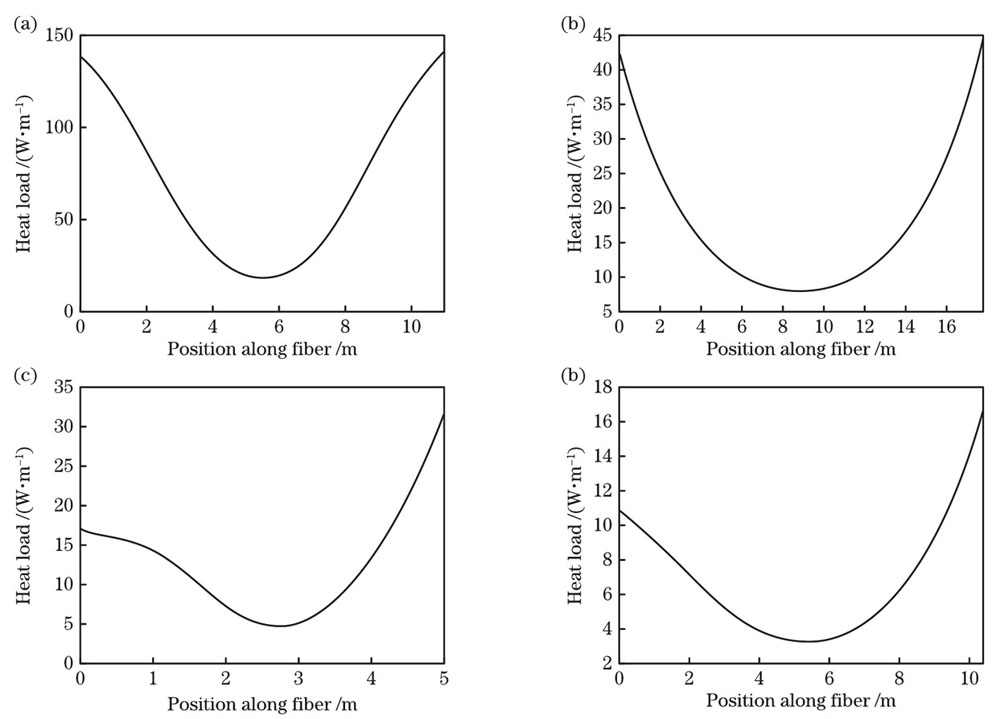
    Fig. 1. Distribution of the heat load for different laser systems at 1 kW output. (a) 793 nm cladding pump; (b) 1570 nm cladding pump; (c) 1910 nm core pump; (d) 1910 nm pedestal pump
    Algorithm diagram for simulation of TMI threshold and outer cladding damage threshold
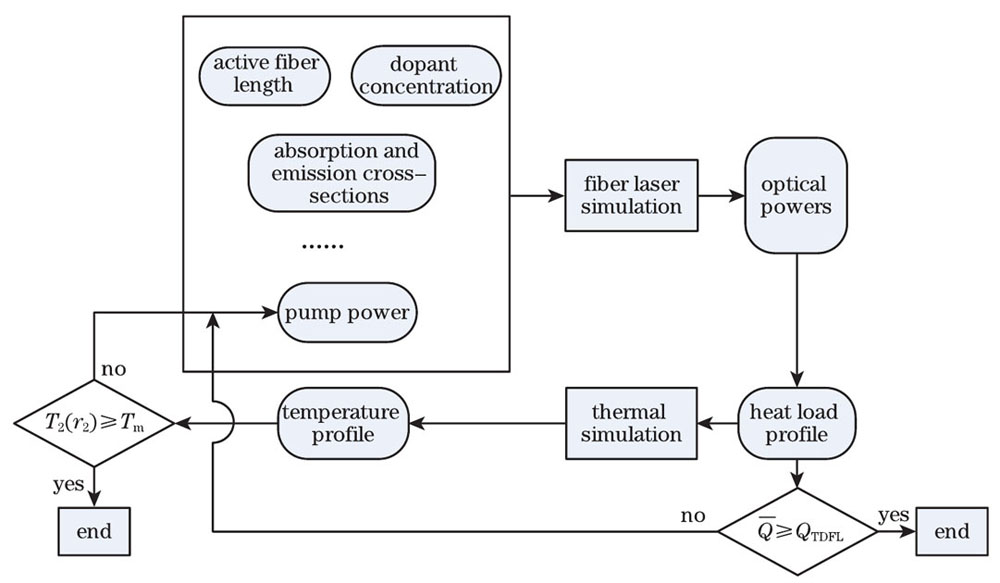
    Fig. 2. Algorithm diagram for simulation of TMI threshold and outer cladding damage threshold
    Pump absorption with a constant nominal total absorption. (a) Forward pump distribution; (b) total absorption of pump
    Fig. 3. Pump absorption with a constant nominal total absorption. (a) Forward pump distribution; (b) total absorption of pump
    Power limitation of Tm-doped fiber laser at 1570 nm pump
    Fig. 4. Power limitation of Tm-doped fiber laser at 1570 nm pump
    Power limitation of Tm-doped fiber laser at 1910 nm pump. (a) Core pump; (b) pedestal pump
    Fig. 5. Power limitation of Tm-doped fiber laser at 1910 nm pump. (a) Core pump; (b) pedestal pump
    ParameterValueParameterValue
    Core radius, r112.5 μmInner cladding radius, r2125 μm
    Pedestal radius, rp22.5 μmOuter cladding radius, r3200 μm
    Heat conductivity of the core and the inner cladding,k1k21.38 W·m-1·K-1Heat conductivity of the outer cladding, k30.2 W·m-1·K-1
    Absorption cross-section@1570 nm, σap15702.0×10-25 m-3[17,28]Emission cross-section@1570 nm,σep15700.096×10-25 m-3[28]
    Absorption cross-section@1910 nm, σap19100.21×10-25 m-3[17,26,28]Emission cross-section@1910 nm, σep19104.97×10-25 m-3[28]
    Absorption cross-section@2010 nm, σap20100.03×10-25 m-3[28]Emission cross-section@2010 nm, σep20102.56×10-25 m-3[7,28]
    Doping concentration of LC TDF, NLC14.5×1025 m-3Doping concentration of HC TDF, NHC28.5×1025 m-3
    Thermo-optic coefficient of silica, k1.2×10-5 K-1Lifetime of 3F4 energy level, τ500 μs [17]
    Table 1. Parameters used in the simulation
    Pump bandLaser configurationOptimal TDF length /mSlope efficiency /%Quantum efficiency /%
    793 nmCP+HC5.064.0162.2
    CP+LC11.054.4137.9
    1570 nmCP+HC10.076.497.8
    CP+LC17.875.296.3
    1910 nmCoP+HC2.694.399.2
    CoP+LC5.093.998.8
    PP+HC5.693.798.6
    PP+LC10.492.897.7
    Table 2. Optimal gain fiber length and corresponding slope efficiency of different laser systems at 1 kW output
    Pump bandLaser configurationPump /WAbsorbed pump /WHeat /WRatio /%
    793 nmCP+LC1810180880880.8
    1570 nmCP+LC1335132732732.7
    1910 nmCoP+LC10671066666.6
    PP+LC10811078787.8
    Table 3. Power characteristics of different laser systems at 1 kW output
    Pump bandLaser configurationAverage heat load /(W·m-1)Maximum temperature /℃@H1Maximum temperature /℃@H2
    CoreOuter claddingCoreOuter cladding
    793 nmCP+HC104.3407.7323.1220.2135.6
    CP+LC69.3227.6182.0126.580.9
    1570 nmCP+HC30.1141.6114.681.854.7
    CP+LC17.883.268.851.437.0
    1910 nmCoP+HC22.1103.884.962.143.3
    CoP+LC12.563.953.741.331.1
    PP+HC11.161.151.639.930.3
    PP+LC6.841.736.329.824.4
    Table 4. Thermal characteristics of different laser systems at 1 kW output
    ParameterValueParameterValue
    Peak gain of SRS,gR*0.5×10⁻¹³ m/W [13]Peak gain of SBS,gB1.2×10-11 m/W [36]
    Linewidth of SBS gain,ΔνB10.0 MHz [12]Laser linewidth,Δν1.0 GHz
    Melting temperature of the core,TM1709.9 ℃ [12]Damage temperature of the outer cladding,Tm105.0 ℃ [12]
    Coolant temperature,Tc16.9 ℃ [13]Average heat load of TDFL at TMI threshold,Q¯TDFL136.0 W/m [18]
    Signal gain, G10.0 [13]Optical damage limit,IOD35.0 W/μm2[14]
    Table 5. Parameters used in the estimation of power limit factors
    Pump bandLaser configurationSBS@1 GHz /kWSRS /kWTMI /kWTL /kWOCD /kWOD /kW
    H1H2
    1570 nmCP+HC14.741.74.4165.02.46.312.7
    CP+LC8.323.47.4275.04.110.512.7
    1910 nmCoP+HC56.7160.35.8219.23.28.412.7
    CoP+LC29.583.310.5392.25.815.012.7
    PP+HC26.374.411.3389.06.316.212.7
    PP+LC14.240.118.2626.110.126.112.7
    Table 6. Estimation of power limit for different laser systems at optimal gain fiber lengths
    Pump configurationMaximum output powers /kW
    H1H2
    1570 nm CP2.95.9
    1910 nm CoP7.212.6
    1910 nm PP7.412.7
    Table 7. Maximum output powers for different pump configurations
    Mengmeng Tao, Xisheng Ye, Jingfeng Ye, Ting Yu, Zhao Quan, Yunfeng Qi, Guobin Feng, Weibiao Chen. Modeling In-band Pumped kW Level High-Power Tm-Doped Fiber Lasers via Simulations[J]. Chinese Journal of Lasers, 2022, 49(1): 0101019
    Download Citation