• Laser & Optoelectronics Progress
  • Vol. 56, Issue 6, 061002 (2019)
Liangfu Li** and Ruiyun Sun*
Author Affiliations
  • School of Computer Science, Shaanxi Normal University, Xi'an, Shaanxi 710119, China
  • show less
    DOI: 10.3788/LOP56.061002 Cite this Article Set citation alerts
    Liangfu Li, Ruiyun Sun. Bridge Crack Detection Algorithm Based on Image Processing under Complex Background[J]. Laser & Optoelectronics Progress, 2019, 56(6): 061002 Copy Citation Text show less
    Schematic of dataset amplification of bridge crack images. (a) Original image; (b) horizontal flip; (c) vertical flip; (d) linear transformation; (e) spatial filtering transformation
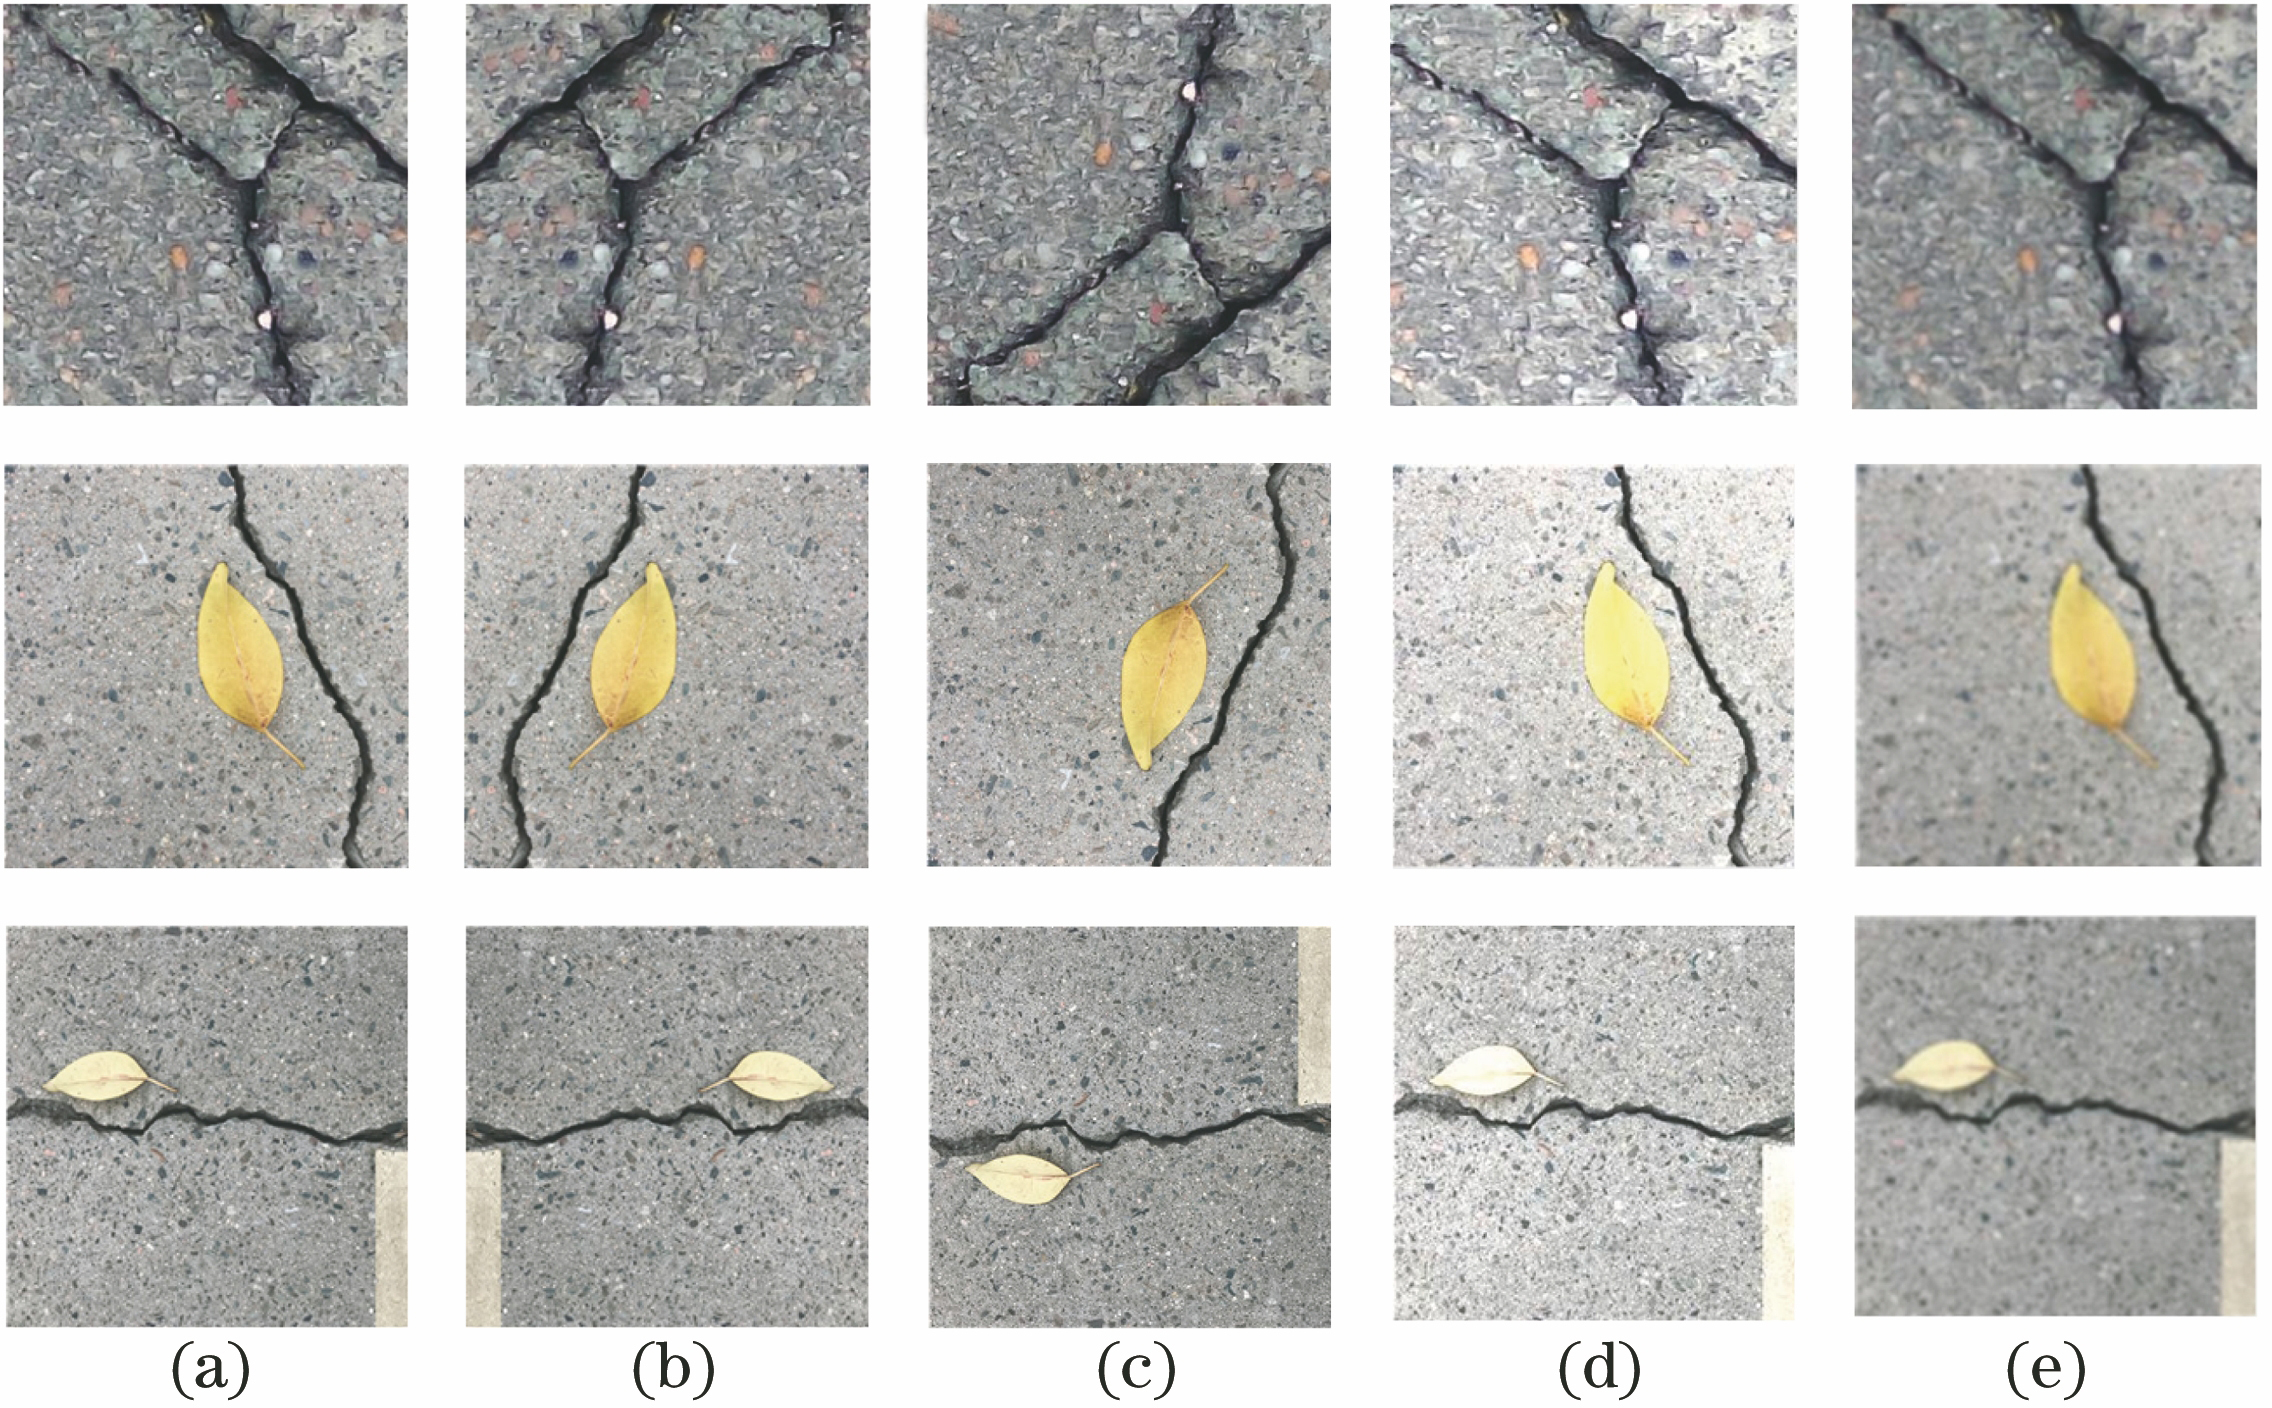
    Fig. 1. Schematic of dataset amplification of bridge crack images. (a) Original image; (b) horizontal flip; (c) vertical flip; (d) linear transformation; (e) spatial filtering transformation
    Generative model
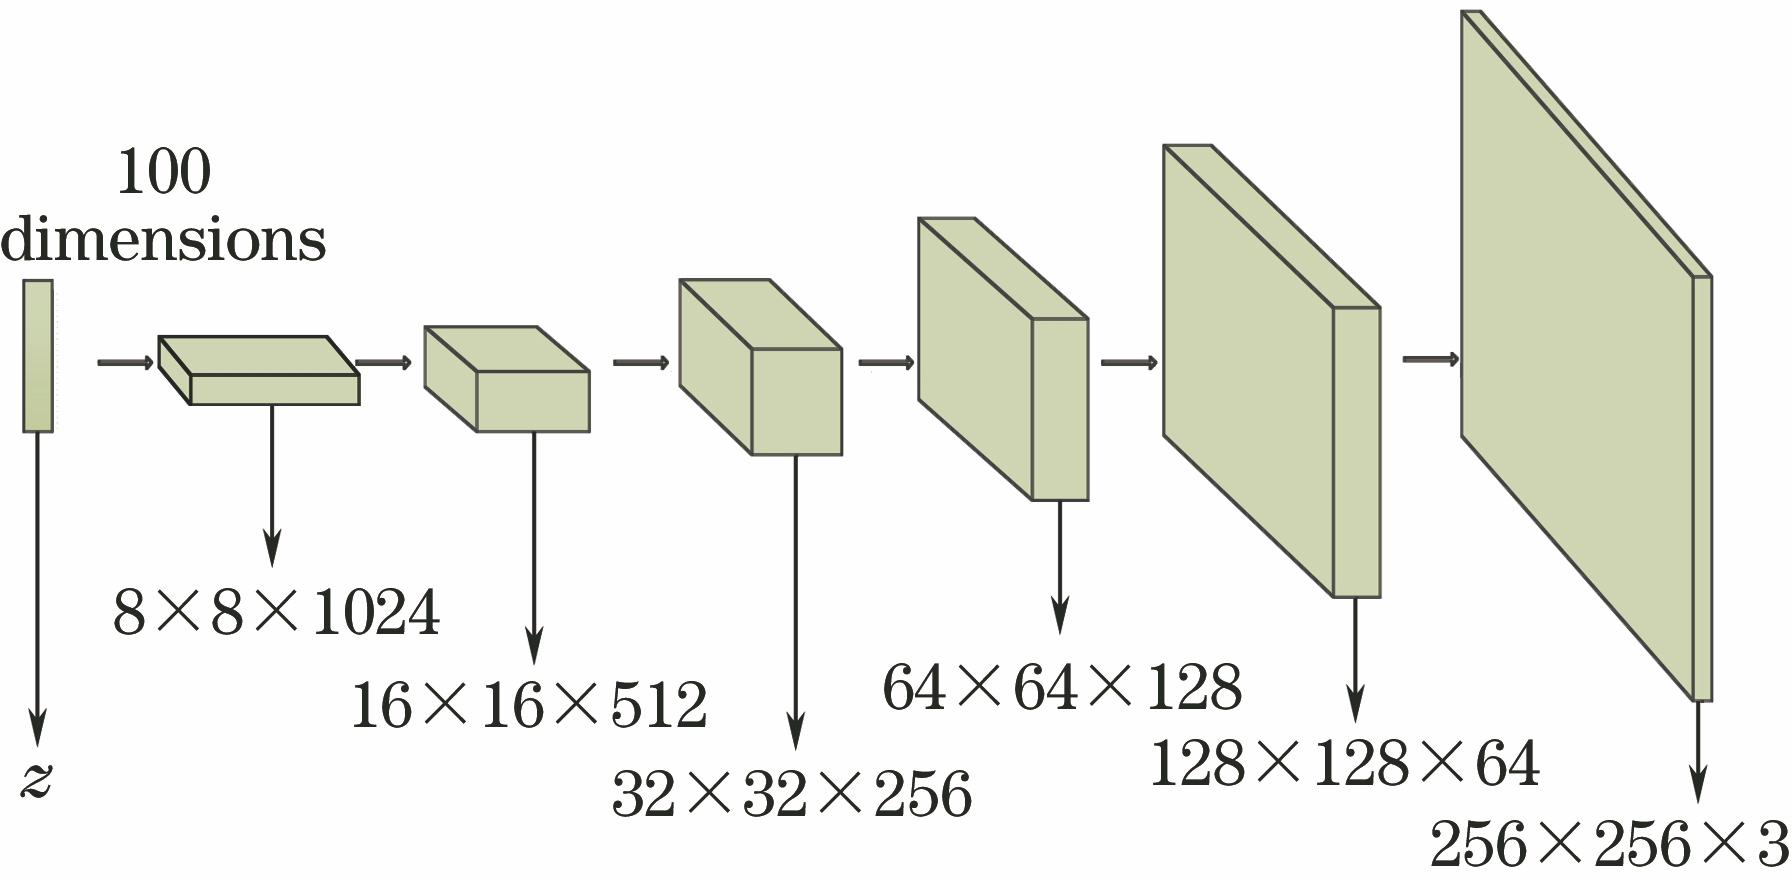
    Fig. 2. Generative model
    Discriminant model
    Fig. 3. Discriminant model
    Schematic of 4-layer DenseBlock
    Fig. 4. Schematic of 4-layer DenseBlock
    Schematic of detection of high-resolution image
    Fig. 5. Schematic of detection of high-resolution image
    Visualization comparison of cracks generated by DCGAN and BCIGM. (a) Nepoch=01; (b) Nepoch=03; (c) Nepoch=16; (d) Nepoch=25
    Fig. 6. Visualization comparison of cracks generated by DCGAN and BCIGM. (a) Nepoch=01; (b) Nepoch=03; (c) Nepoch=16; (d) Nepoch=25
    Visualization comparison of cracks generated by ReLU and SeLU. (a) Nepoch=01; (b) Nepoch=03; (c) Nepoch=16; (d) Nepoch=25
    Fig. 7. Visualization comparison of cracks generated by ReLU and SeLU. (a) Nepoch=01; (b) Nepoch=03; (c) Nepoch=16; (d) Nepoch=25
    Visualization comparison of experimental results with and without dataset amplification. (a) Original image; (b)label; (c) without dataset amplification; (d) with dataset amplification
    Fig. 8. Visualization comparison of experimental results with and without dataset amplification. (a) Original image; (b)label; (c) without dataset amplification; (d) with dataset amplification
    Comparison of crack detection results between existing algorithms and proposed algorithm. (a) Original image; (b) label; (c) threshold segmentation algorithm; (d) Canny algorithm; (e) NB-CNN algorithm; (f) random structure forest algorithm; (g) proposed algorithm
    Fig. 9. Comparison of crack detection results between existing algorithms and proposed algorithm. (a) Original image; (b) label; (c) threshold segmentation algorithm; (d) Canny algorithm; (e) NB-CNN algorithm; (f) random structure forest algorithm; (g) proposed algorithm
    Partial crack detection results by proposed algorithm. (a) Scene 1; (b) scene 2; (c) scene 3
    Fig. 10. Partial crack detection results by proposed algorithm. (a) Scene 1; (b) scene 2; (c) scene 3
    Name oflayerSize ofkernel /(pixel×pixel)Stride /pixelSize of output featuremap /(pixel×pixel)Number offeature map
    Inputlayer--256×2563
    ConvolutionConvolution 5×51256×25648
    DenseBlockConvolution [3×3]×41256×25696
    Transition DownConvolution 1×11256×25696
    Max pooling 2×22128×12896
    DenseBlockConvolution [3×3]×51128×128156
    Transition DownConvolution 1×11128×128156
    Max pooling 2×2264×64156
    DenseBlockConvolution [3×3]×7164×64240
    Transition DownConvolution 1×1164×64240
    Max pooling 2×2232×32240
    DenseBlockConvolution [3×3]×10132×32360
    Transition DownConvolution 1×1132×32360
    Max pooling 2×22216×16360
    DenseBlockConvolution [3×3]×12116×16504
    Transition UpDeconvolution 3×3232×32504
    DenseBlockConvolution [3×3]×10132×32624
    Transition UpDeconvolution 3×3264×64624
    DenseBlockConvolution [3×3]×7164×64444
    Transition UpDeconvolution 3×32128×128444
    DenseBlockConvolution [3×3]×51128×128300
    Transition UpDeconvolution 3×32256×256300
    DenseBlockConvolution [3×3]×41256×256204
    ConvolutionConvolution 1×11256×2562
    Softmax----
    Table 1. Network structure parameters of BCISM
    Type ofpictureSimplebackgroundBackgroundwith obstaclesBackgroundwith largearea of stains
    Number ofpictures10449132755710
    Proportion /%35.545.119.4
    Table 2. Proportion of number of different types of images in total dataset
    ConditionTime /s
    Without 1×1 convolution kernel5.4801
    With 1×1 convolution kernel5.4312
    Table 3. Influence of BCIGM on training speed under different conditions
    Number oftraining samplesWith or withoutdataset amplificationNumber ofverification samplesPPrecision /%PRecall /%
    1183Without dataset amplification15613.517.9
    29434With dataset amplification15692.992.6
    Table 4. Effect of dataset amplification on experimental results
    ModelPre-trainingParameter /MPPrecision /%PRecall /%PF1_Score /%Time /s
    SegNetTrue29.574.078.576.20.5823
    FCN8True134.586.983.485.10.3739
    DeepLabTrue37.382.680.981.70.9751
    FC-DenseNet56 (k=12)False1.589.887.688.70.1685
    FC-DenseNet67 (k=16)False3.589.088.888.90.2635
    FC-DenseNet103 (k=16)False9.493.092.192.50.2795
    BCISM (k=12)False2.892.992.692.80.1998
    Table 5. Comparison of exiting semantic segmentation models and BCISM
    Liangfu Li, Ruiyun Sun. Bridge Crack Detection Algorithm Based on Image Processing under Complex Background[J]. Laser & Optoelectronics Progress, 2019, 56(6): 061002
    Download Citation