• Laser & Optoelectronics Progress
  • Vol. 56, Issue 22, 223003 (2019)
Youliang Yang, Lu Wang*, and Cuihong Ma
Author Affiliations
  • College of Electrical Engineering, North China University of Science and Technology, Tangshan, Hebei 063210, China
  • show less
    DOI: 10.3788/LOP56.223003 Cite this Article Set citation alerts
    Youliang Yang, Lu Wang, Cuihong Ma. Quantitative Analysis of Mn in Molten Steel with Multi-Factor Calibration Input Using Laser-Induced Breakdown Spectroscopy[J]. Laser & Optoelectronics Progress, 2019, 56(22): 223003 Copy Citation Text show less
    Experimental platform of LIBS
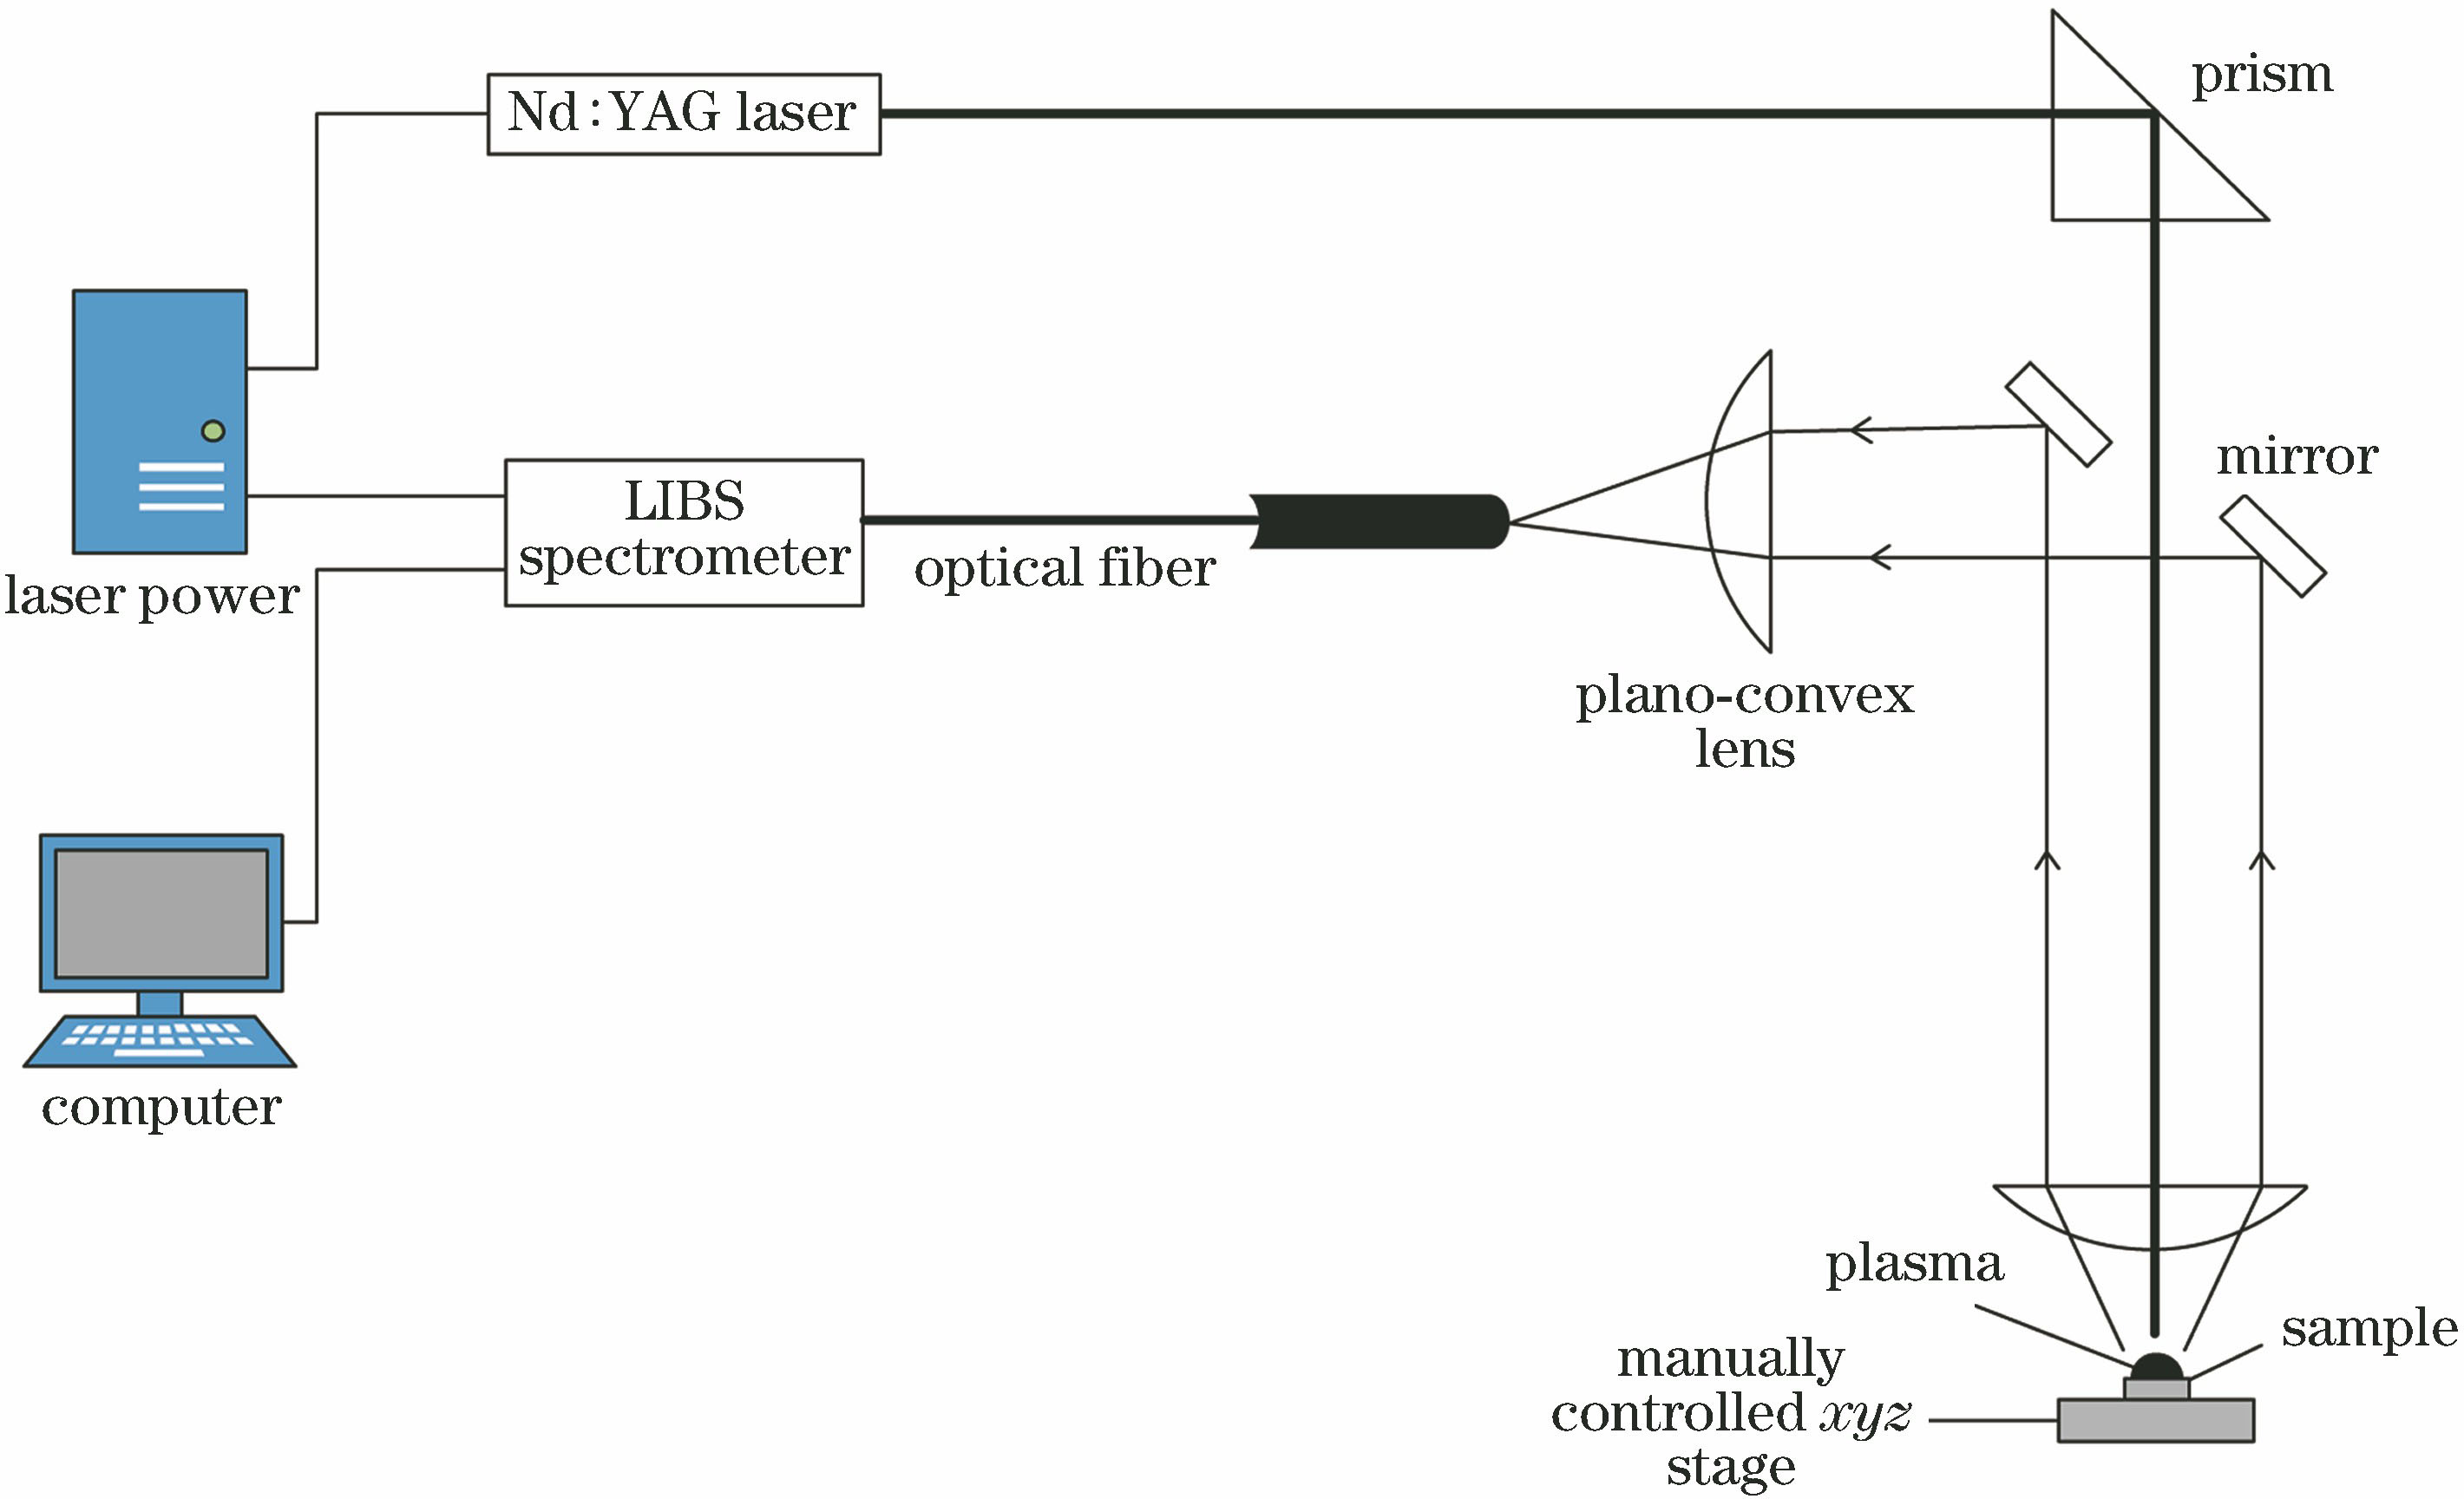
    Fig. 1. Experimental platform of LIBS
    Typical LIBS spectrum of ERM281-1 in the range of 400-410 nm
    Fig. 2. Typical LIBS spectrum of ERM281-1 in the range of 400-410 nm
    Comparison of SVR regression prediction results on test set. (a) RSD; (b) RE
    Fig. 3. Comparison of SVR regression prediction results on test set. (a) RSD; (b) RE
    Sample numberFeNiMnCrSiCuCoPS
    ERM281-170.3299.3700.2580.0480.9290.0760.0230.0120.016
    ERM282-167.15010.8600.4750.0860.7340.1090.0000.0190.004
    ERM279-275.78610.6030.7860.0880.5160.1070.0000.0000.000
    ERM284-2D67.49610.7201.7440.0200.5370.1830.0530.0260.024
    ERM287-1D67.43910.3501.4800.0160.5690.2030.1480.0270.001
    ERM289-1D55.23824.6801.1060.0490.5310.0000.0650.0120.003
    ERM292-1D68.92710.0900.9760.0370.4020.0390.0260.0180.006
    ERM295-1D48.36024.4000.3970.0170.4181.4810.0450.0170.001
    ERM296-1D82.0205.7900.5450.1170.2420.14980.02180.0180.003
    ERM298-1D63.3807.0560.3160.01460.2620.2010.0550.0200.001
    Table 1. Mass fraction of each element of steel samples%
    Input variable1231+21+32+31+2+3
    R0.8700.9340.9400.9180.9220.9710.967
    RMSE2.2670.9401.1681.1960.7190.3670.456
    Table 2. R and RMSE of training model
    Mass fractionof Mn /%RSD /%RE /%
    32+332+3
    0.25881.34.515.1107.6
    0.47515.42.743.510.4
    0.78611.11.236.618.0
    1.74421.71.34.43.7
    1.48016.92.525.35.8
    1.10618.63.128.97.4
    0.97623.31.627.210.2
    0.3977.84.825.922.2
    0.5459.51.824.618.6
    0.31618.62.527.711.4
    Table 3. SVR regression prediction results on test set under different mass fractions of Mn
    Youliang Yang, Lu Wang, Cuihong Ma. Quantitative Analysis of Mn in Molten Steel with Multi-Factor Calibration Input Using Laser-Induced Breakdown Spectroscopy[J]. Laser & Optoelectronics Progress, 2019, 56(22): 223003
    Download Citation