
Yueyang Yu, Zelin Shi, Yunpeng Liu. Foreground-Aware Based Spatiotemporal Correlation Filter Tracking Algorithm[J]. Laser & Optoelectronics Progress, 2019, 56(22): 221503
- Laser & Optoelectronics Progress
- Vol. 56, Issue 22, 221503 (2019)
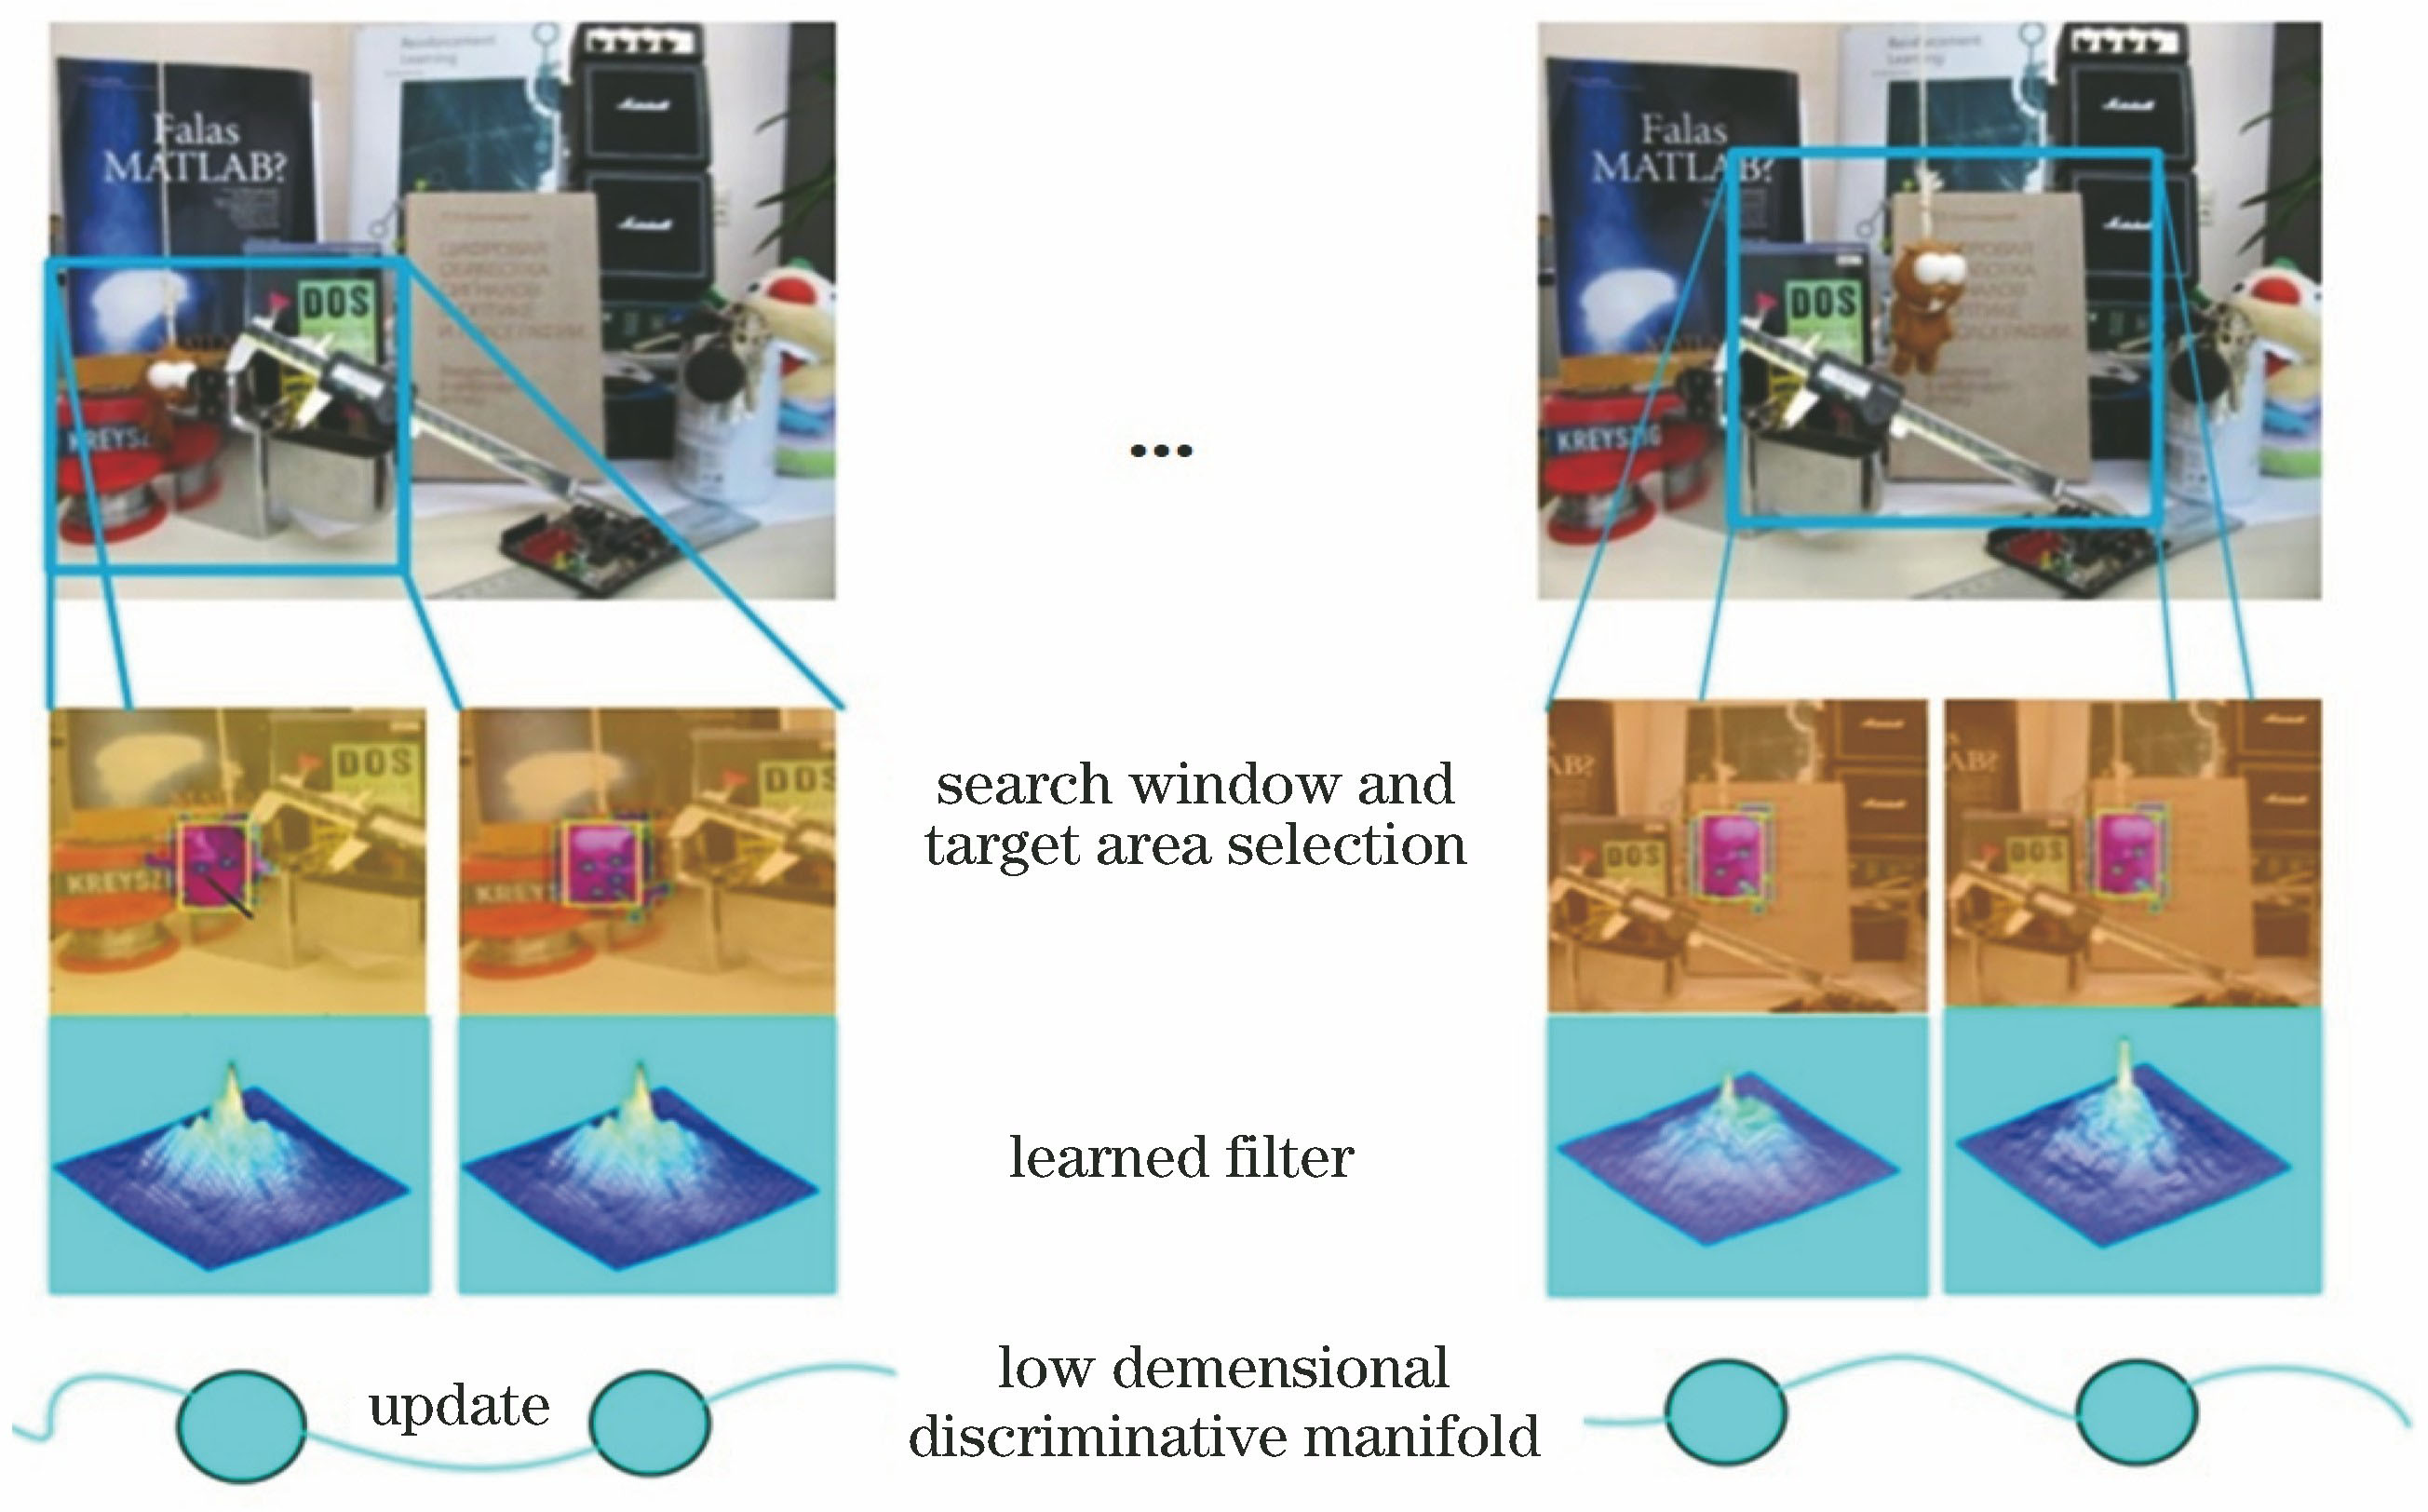
Fig. 1. Temporal consistency constraints with object area selection function explained by sequence Tiger
![Take one-dimensional vector as example, assuming length of target is D=3. Left side is one-dimensional signal xi with L=5. xi[Δτj] image is result of all cyclic shifts. Five one-dimensional vectors with length of 3 can be obtained by multiplying mask matrix P on this image, where first 3 rows are real positive samples with same size of object](/richHtml/lop/2019/56/22/221503/img_2.jpg)
Fig. 2. Take one-dimensional vector as example, assuming length of target is D=3. Left side is one-dimensional signal xi with L=5. xi[Δτj] image is result of all cyclic shifts. Five one-dimensional vectors with length of 3 can be obtained by multiplying mask matrix P on this image, where first 3 rows are real positive samples with same size of object
Fig. 3. Comparison of training samples between traditional correlation filters and proposed method. (a) Cyclic-shift training samples of traditional correlation filter; (b) training samples of foreground-aware correlation filter
Fig. 4. Relationship between IoU value and tracking confidence score for carRace and ball sequences without re-detector. (a) Relationship between IoU value of carRace and tracking confidence score; (b) 502nd-frame tracking result of carRace; (c) 510th-frame tracking result of carRace; (d) relationship between IoU of ball and tracking confidence score; (e) 209th-frame tracking result of ball; (f) 211st-frame tracking result of ball
Fig. 5. Plots of OPE and success rate of trackers with traditional features on OTB-2013 dataset. (a) Plots of OPE; (b) plots of success rate
Fig. 6. Plots of OPE and success rate of trackers with convolutional features on OTB-2013 dataset. (a) Plots of OPE; (b) plots of success rate
Fig. 7. Comparison of tracking results of SiamFC, CCOT, DSST, KCF, ECO, CF2, and proposed algorithm on 8 challenging sequences from OTB-2015 dataset. From top to bottom: singer2, girl2, tiger, bird1, dragonbaby, motorrolling, skiing, and soccer
|
Table 1. Success rate, precision, and tracking speed of tracking algorithm based on traditional features on OTB-2013 dataset
|
Table 2. Performance evaluation of each tracker on OTB-2013 dataset
|
Table 3. Success rate, precision, and tracking speed of tracking algorithm based on convolutional features on OTB-2013 dataset
|
Table 4. Evaluations of EAO, precision, and robustness of algorithms on VOT2016 dataset

Set citation alerts for the article
Please enter your email address
© Copyright 2018-2021 | Chinese Laser Press. All Rights Reserved 沪ICP备15018463号-20