
Yu Song, Zhenping Xia, Fuyuan Hu, Cheng Cheng. Compensation Technology of Dynamic Image Perception Effect of Liquid Crystal Display[J]. Laser & Optoelectronics Progress, 2021, 58(24): 2410004
- Laser & Optoelectronics Progress
- Vol. 58, Issue 24, 2410004 (2021)
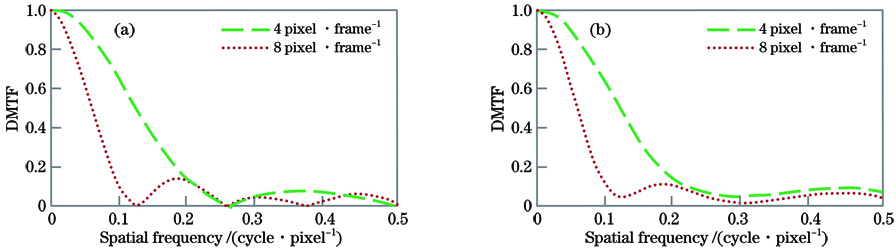
Fig. 1. DMTF at different moving velocities and tracking speed ratio g. (a) g=1; (b) g<1
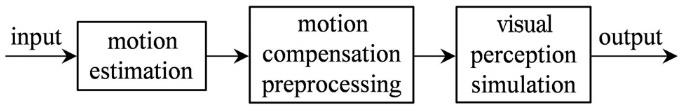
Fig. 2. Schematic diagram of compensation model framework for dynamic image perception effect
Fig. 3. Preprocessing images displayed in eight-bit display system. (a) 8 pixel·frame-1 preprocessing image for 10 bit display system (I=1); (b) 4 pixel·frame-1 preprocessing image for 10 bit display system (I=1); (c) 8 pixel·frame-1 preprocessing image for 8 bit display system (I=0.1); (d) 4 pixel·frame-1 preprocessing image for 8 bit display system (I=0.18)
Fig. 4. Function curves at moving speed of 4 pixel·frame-1. (a) DMTFC' for different I values; (b) DMTF obtained by visual perception after image preprocessing
Fig. 5. Image motion compensation preprocessing process. (a) Original image; (b) spectra of image pixels (dotted line); (c) adaptive DMTFC'; (d) spectra after preprocessing; (e) image after preprocessing
Fig. 6. Simulation process of dynamic image perception effect. (a) Image after preprocessing; (b) spectra of image pixels (dotted line); (c) DMTF at moving speed of 8 pixel·frame-1; (d) spectra after motion blur processing; (e) visual perception image after motion compensation
Fig. 7. Six original images of different types. (a) Human; (b) animal; (c) scenery; (d) animation; (e) architecture; (f) vehicle
Fig. 8. Simulation of dynamic image perception effect. (a) Original images; (b) dynamic perception effect of original images; (c) preprocessing visual perception images of 8 bit display system; (d) preprocessing visual perception images of 10 bit display system
Fig. 9. Visual perception experiment settings
Fig. 10. Mean score and confidence interval of motion blur corresponding to different motion compensation processes. (a) Simulated velocity is 4 pixel·frame-1; (b) simulated velocity is 8 pixel·frame-1
|
Table 1. Grading standard of visual perception experiment
|
Table 2. Results of ANOVA analysis for different factors influencing on image quality

Set citation alerts for the article
Please enter your email address
© Copyright 2018-2021 | Chinese Laser Press. All Rights Reserved 沪ICP备15018463号-20