
Lu-lu SONG, Wei-qiang CHEN, Min DAI. Stocks and flows of steel in automobiles, vessels and household appliances in China[J]. Journal of Natural Resources, 2020, 35(4): 895
- Journal of Natural Resources
- Vol. 35, Issue 4, 895 (2020)
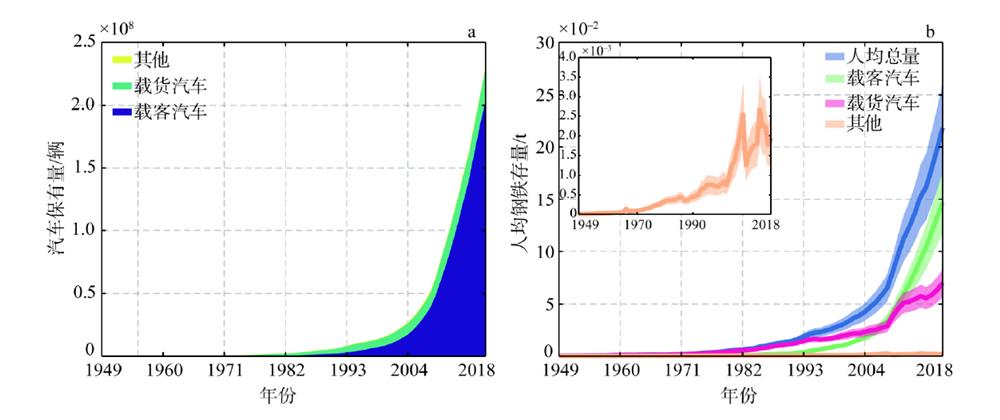
Fig. 1. Product stocks and per-capita steel stocks in automobiles in China from 1949 to 2018
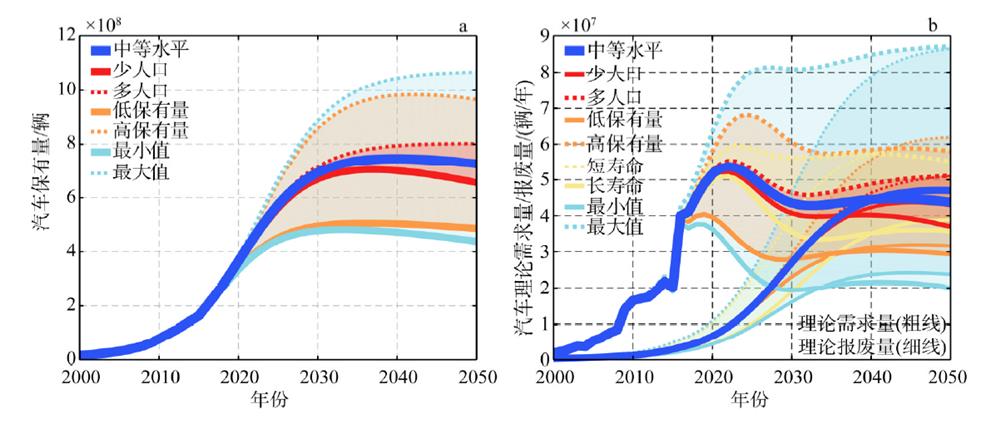
Fig. 2. Product stocks and flows in automobiles in China from 2000 to 2050
Fig. 3. Steel stocks and flows in automobiles in China from 2000 to 2050
Fig. 4. Stocks of deadweight tonnage and per-capita steel stocks in vessels in China from 1978 to 2018
Fig. 5. Stocks of deadweight tonnage and flows in vessels in China from 1978 to 2050
Fig. 6. Steel stocks and flows in vessels in China from 1978 to 2050
Fig. 7. Stocks of main household appliances in urban and rural China from 1980 to 2018
Fig. 8. Per-capita steel stocks of main household appliances in urban and rural China from 1980 to 2018
Fig. 9. Stocks of main household appliances in urban and rural China from 1980 to 2050
Fig. 10. Flows of main household appliances in urban and rural China from 1980 to 2050
Fig. 11. Steel stocks of main household appliances in urban and rural China from 1980 to 2050
Fig. 12. Steel flows of main household appliances in urban and rural China from 1980 to 2050
|
Table 1. Steel intensity for different products
| |||||||||||||||||||||||||||||||||||||||||||||||||||||||||||||||||||||||||||||||||||||||||||||||||||||||||||||||
Table 2. List of parameters for different industries in future scenarios


Set citation alerts for the article
Please enter your email address

© Copyright 2018-2021 | Chinese Laser Press. All Rights Reserved 沪ICP备15018463号-20