
Kaiqiang Xian, Jingzhu Pang, Jun Hu. Surface Crack Size Detection in Nuclear Fuel Rods Based on Line Structured Light[J]. Laser & Optoelectronics Progress, 2020, 57(22): 221013
- Laser & Optoelectronics Progress
- Vol. 57, Issue 22, 221013 (2020)
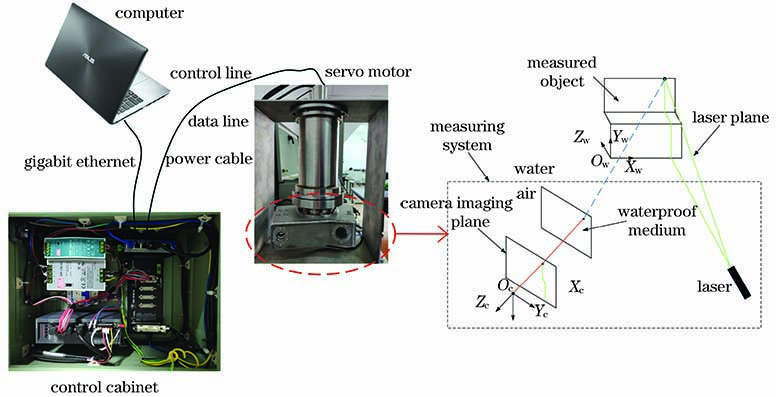
Fig. 1. Underwater nuclear fuel rod detection system
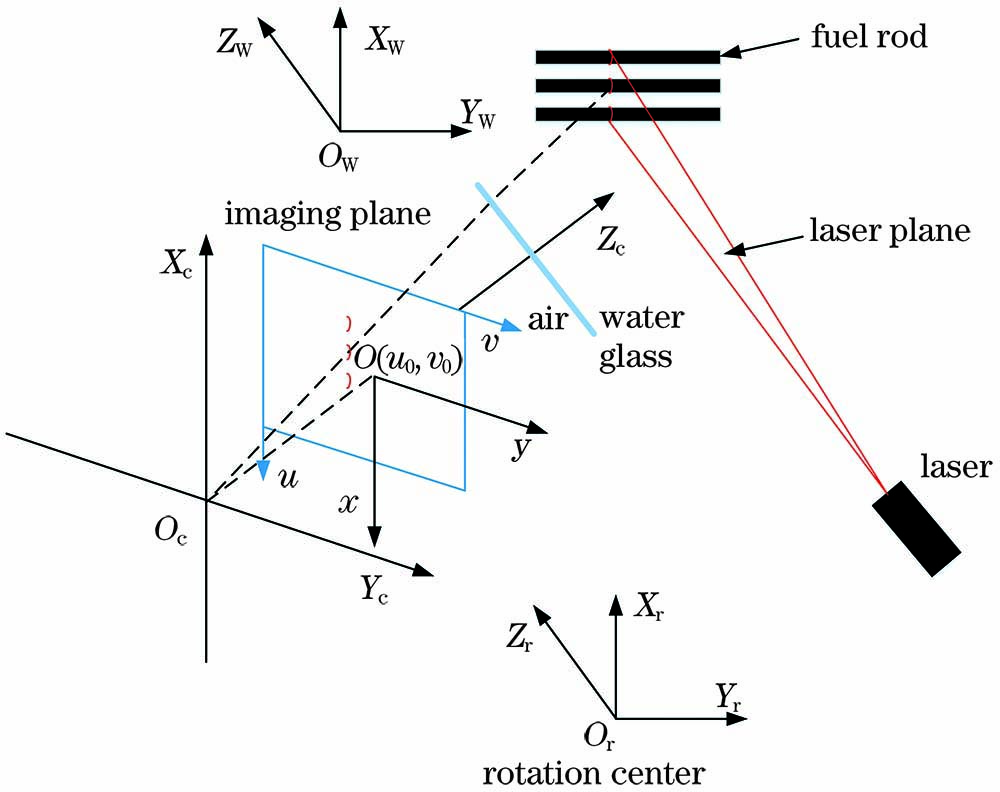
Fig. 2. Mathematical model of mearsured system
Fig. 3. Conversion relationship of rotation center coordinate
Fig. 4. Position and frame selection for region of interest. (a) Original image; (b) diagram of frame selection effect
Fig. 5. Horizontal projection and first-order differential results for fuel rods
Fig. 6. Expansion of the frame selection area. (a) |im-is|≥6; (b)im-is|<6
Fig. 7. Gray statistics image
Fig. 8. Enlarged view of cracks
Fig. 9. Upper boundary judgment method. (a) Boundary pixel type one; (b) boundary pixel type two; (c) boundary pixel type three; (d) boundary pixel type four
Fig. 10. Adaptive threshold segmentation
Fig. 11. Acquisition of structured light bar center at the crack. (a) With a crack; (b) without cracks;(c) removing cracked area for Fig. 11 (a); (d) removing cracked area for Fig. 11 (b); (e) normal light bar center; (f) incomplete light bar center
Fig. 12. Structured light center curve fitting
Fig. 13. Crack boundary treatment. (a) Diagram of boundary decision; (b) intersection diagram of center line and boundary
Fig. 14. Diagram of distance sampling
Fig. 15. Platform operation flowchart
Fig. 16. Underwater experimental device
Fig. 17. Photos taken. (a) Exposure of 200; (b) exposure of 300; (c) exposure of 400; (d) exposure of 500; (e) crack size of 190.0μm; (f) crack size of 181.6μm; (g) crack size of 128.6μm
Fig. 18. Cracks on the surface of nuclear fuel rods. (a) Crack on the surface of fuel rod; (b) point cloud of crack on fuel rod surface
|
Table 1. Center line fitting errors
|
Table 2. Tabel 2 Test results of crack size


Set citation alerts for the article
Please enter your email address

© Copyright 2018-2021 | Chinese Laser Press. All Rights Reserved 沪ICP备15018463号-20