
Bing-ying LEI, Bo-ping XU, Yi-shan WANG, Xiang-ping ZHU, Yi-xiang DUAN, Wei ZHAO, Jie TANG. Investigation of the Spectral Characteristics of Laser-Induced Plasma for Non-Flat Samples[J]. Spectroscopy and Spectral Analysis, 2022, 42(10): 3024
- Spectroscopy and Spectral Analysis
- Vol. 42, Issue 10, 3024 (2022)
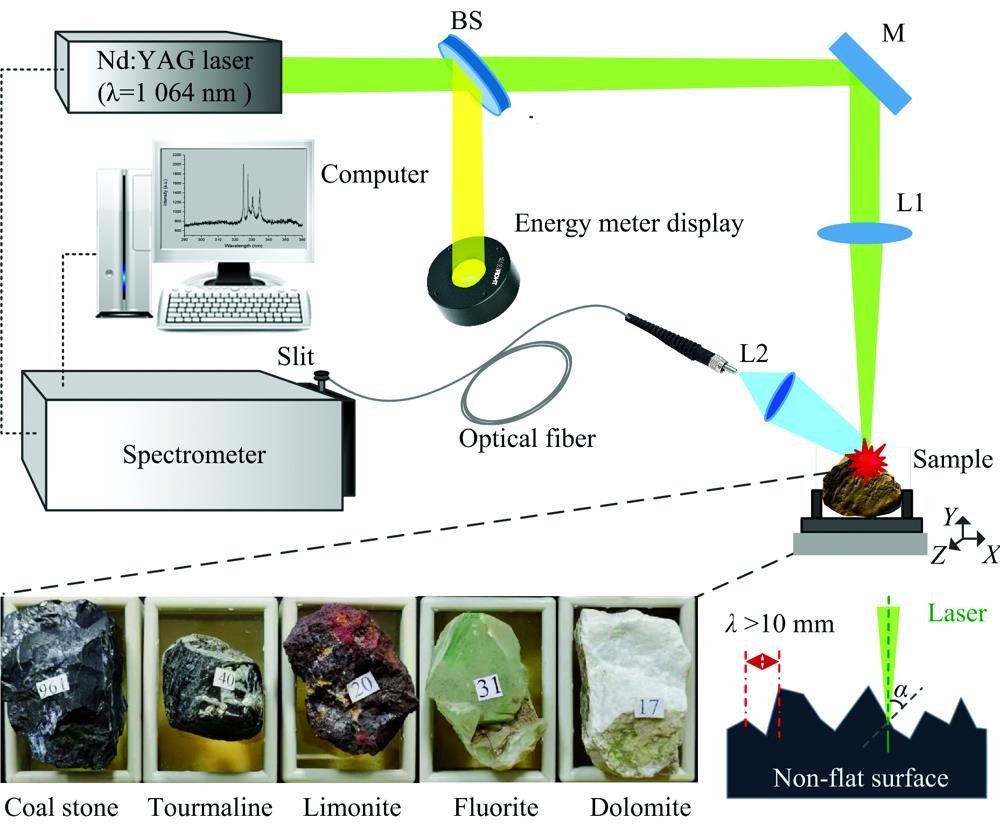
Fig. 1. Schematic diagram of the experimental setup
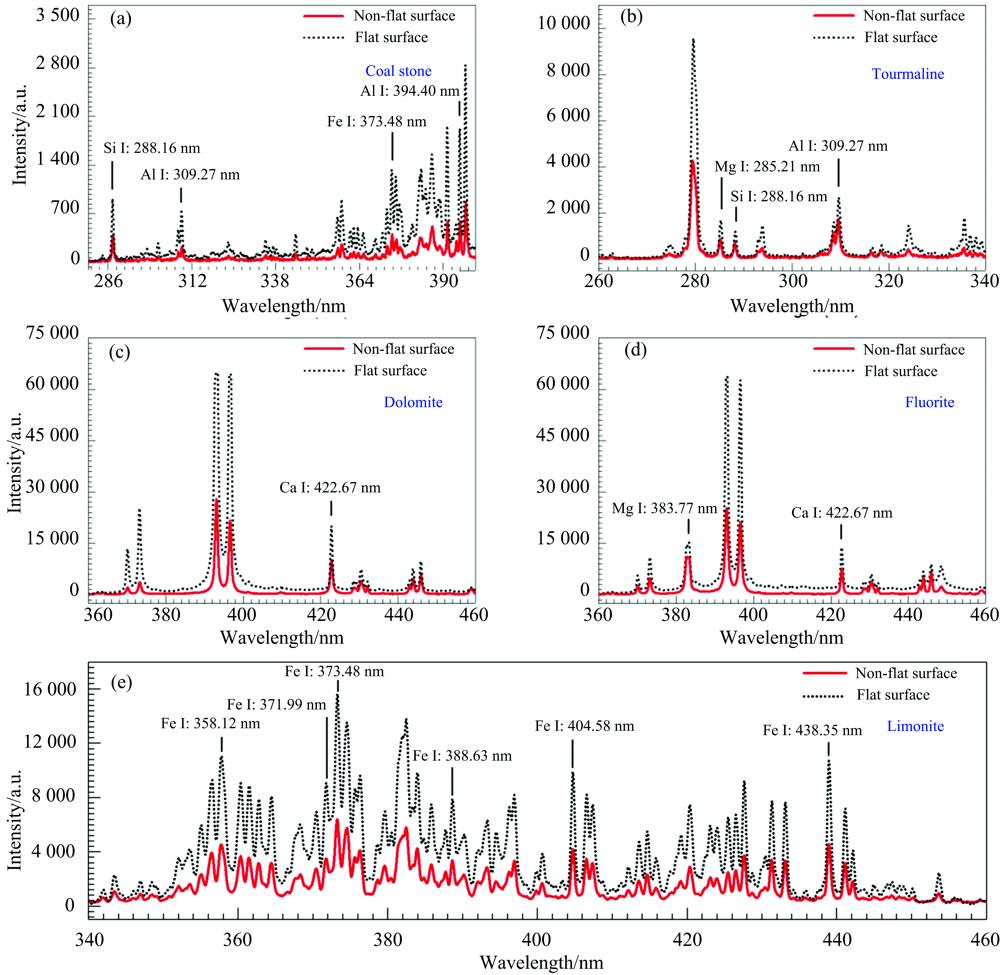
Fig. 2. Comparison of the time-integrated spectra under the conditions of non-flat and flat sample surfaces
The rock samples are (a) Coal stone, (b) Tourmaline, (c) Dolomite, (d) Fluorite, and (e) Limonite, respectively
The rock samples are (a) Coal stone, (b) Tourmaline, (c) Dolomite, (d) Fluorite, and (e) Limonite, respectively
Fig. 3. The influence of laser energy on spectral peak intensity (Fe Ⅰ 404.58 nm and Fe Ⅰ 438.35 nm) under the conditions of non-flat and flat sample surface
The variation of (a) the spectral intensity and (b) the reduction factor with laser energy
The variation of (a) the spectral intensity and (b) the reduction factor with laser energy
Fig. 4. Calculation of electron density and plasma temperature
Stark broadening profile of Fe Ⅰ 438.35 nm under the conditions of (a) non-flat and (b) flat sample surface; (c) The variation of electron density with laser energy under the conditions of non-flat and flat sample surface; (d) The variation of the plasma temperature with laser energy under the conditions of non-flat and flat sample surface
Stark broadening profile of Fe Ⅰ 438.35 nm under the conditions of (a) non-flat and (b) flat sample surface; (c) The variation of electron density with laser energy under the conditions of non-flat and flat sample surface; (d) The variation of the plasma temperature with laser energy under the conditions of non-flat and flat sample surface
|
Table 1. Spectroscopic parameters of Fe(Ⅰ) lines in limonite sample

Set citation alerts for the article
Please enter your email address
© Copyright 2018-2021 | Chinese Laser Press. All Rights Reserved 沪ICP备15018463号-20