• Photonics Research
  • Vol. 10, Issue 2, 456 (2022)
Ruo-Jing Ren1、2, Yong-Heng Lu1、2, Ze-Kun Jiang1、2, Jun Gao1、2, Wen-Hao Zhou1、2, Yao Wang1、2, Zhi-Qiang Jiao1、2, Xiao-Wei Wang1、2, Alexander S. Solntsev3, and Xian-Min Jin1、2、4、*
Author Affiliations
  • 1Center for Integrated Quantum Information Technologies (IQIT), School of Physics and Astronomy and State Key Laboratory of Advanced Optical Communication Systems and Networks, Shanghai Jiao Tong University, Shanghai 200240, China
  • 2CAS Center for Excellence and Synergetic Innovation Center in Quantum Information and Quantum Physics, University of Science and Technology of China, Hefei 230026, China
  • 3School of Mathematical and Physical Sciences, University of Technology Sydney, Ultimo, New South Wales 2007, Australia
  • 4TuringQ Co., Ltd., Shanghai 200240, China
  • show less
    DOI: 10.1364/PRJ.445728 Cite this Article Set citation alerts
    Ruo-Jing Ren, Yong-Heng Lu, Ze-Kun Jiang, Jun Gao, Wen-Hao Zhou, Yao Wang, Zhi-Qiang Jiao, Xiao-Wei Wang, Alexander S. Solntsev, Xian-Min Jin. Topologically protecting squeezed light on a photonic chip[J]. Photonics Research, 2022, 10(2): 456 Copy Citation Text show less
    Schematic diagram of the lattice with topological protection for squeezed light. (a) The structure of the lattice contains seven groups with lattice distances ranging from 5 mm to 35 mm. The short and long separations between adjacent waveguides are 7 μm and 9 μm, respectively. (b) Spectrum of the lattice. There are only two quasi zero-energy modes E10 and E11 and two extended bulk bands. Modes E10 and E11 are located inside the bandgap and decouple from the bulk bands, which promotes topological protection. a.u., arbitrary units. (c) Spatial distribution with combined local density of states (LDOS) for the quasi zero-energy modes E10 and E11 (upper line) marked by red in (b) and bulk modes (bottom line) marked by gray in (b).
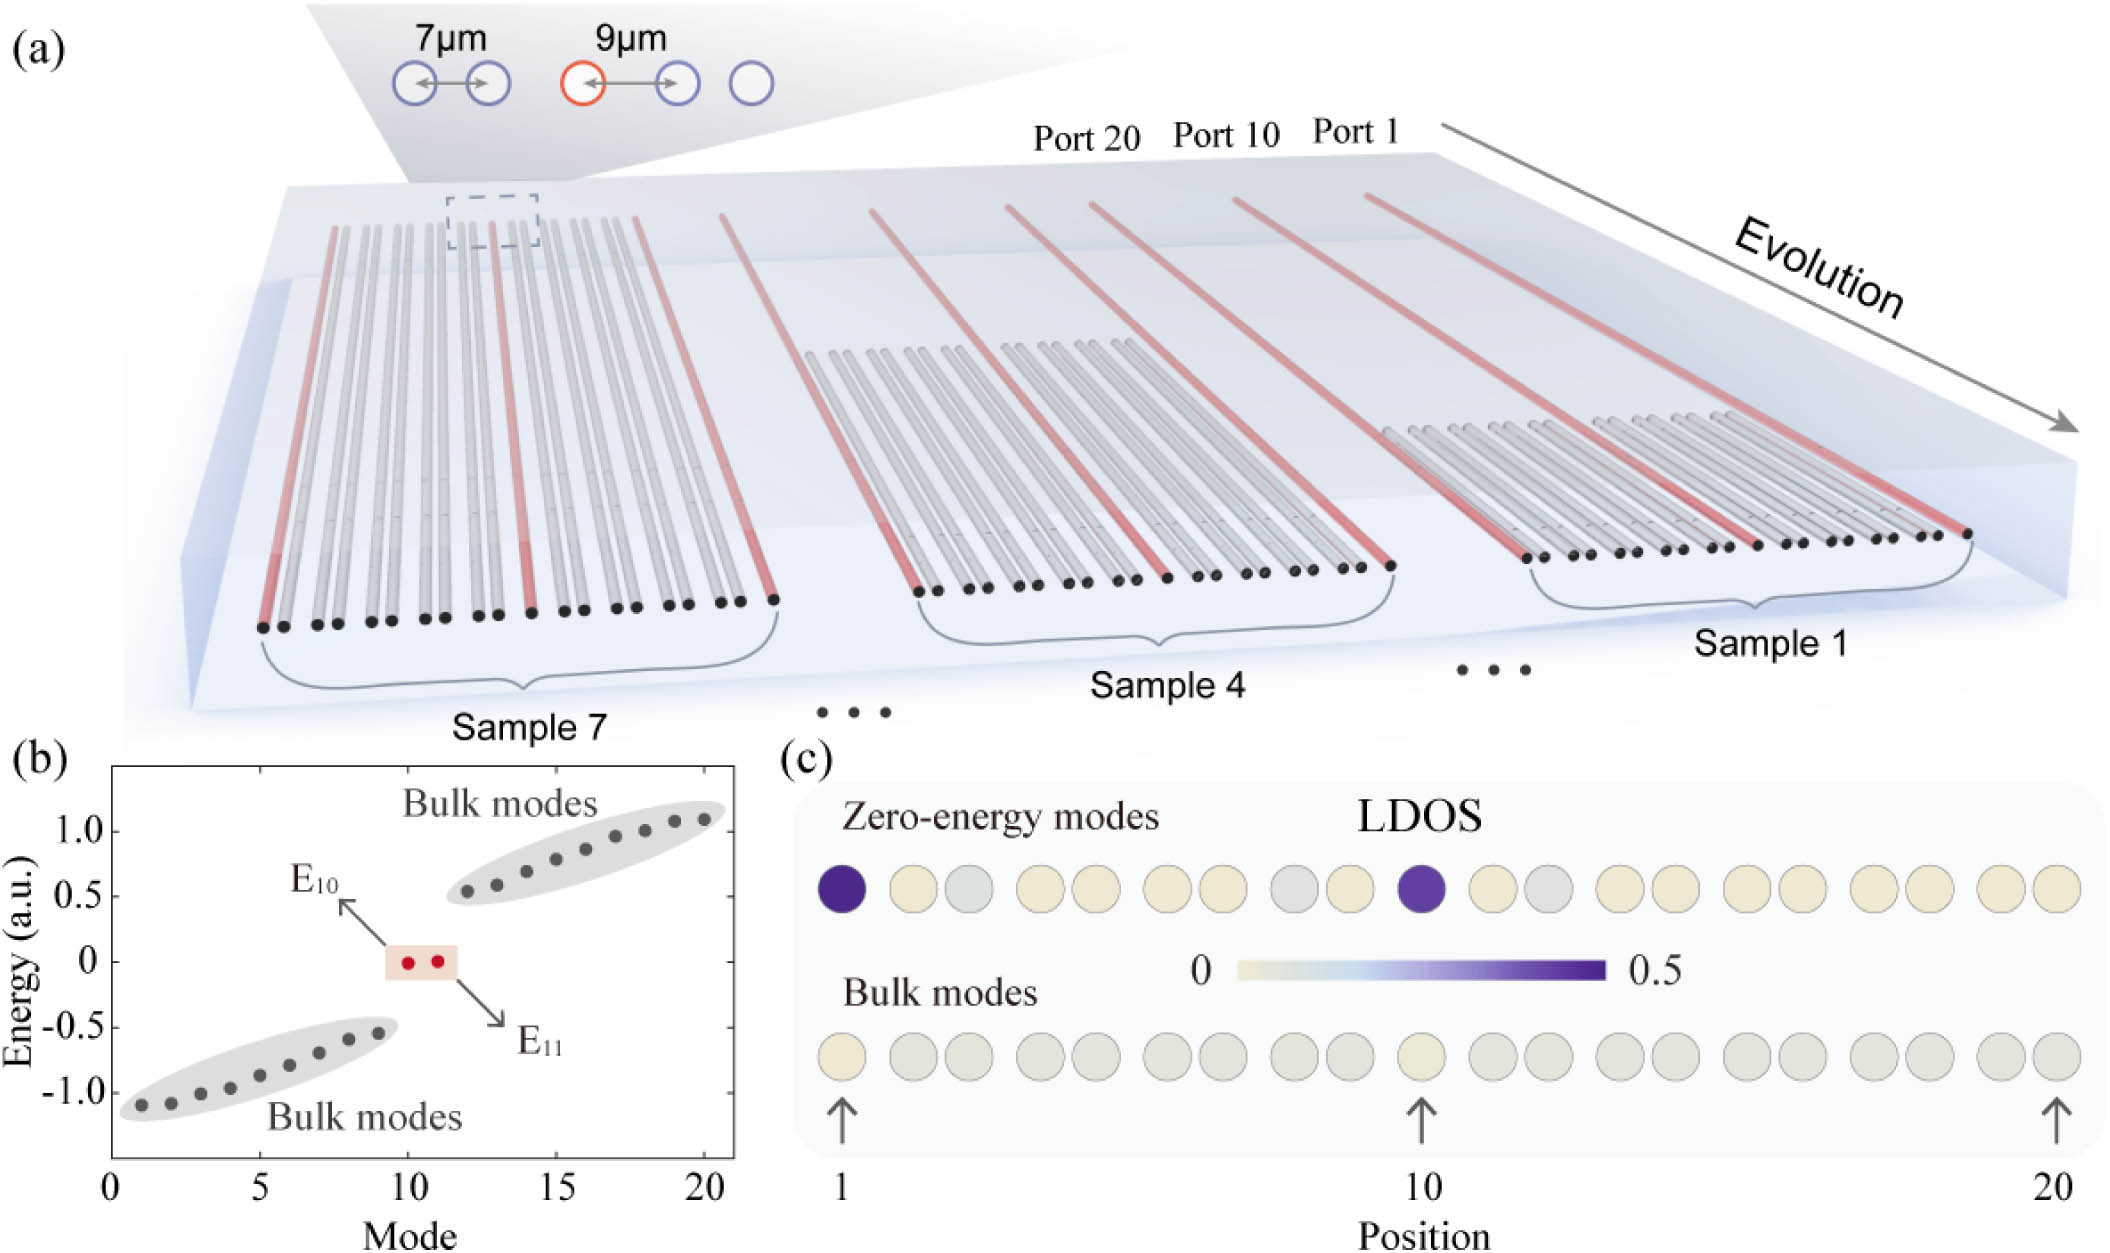
    Fig. 1. Schematic diagram of the lattice with topological protection for squeezed light. (a) The structure of the lattice contains seven groups with lattice distances ranging from 5 mm to 35 mm. The short and long separations between adjacent waveguides are 7 μm and 9 μm, respectively. (b) Spectrum of the lattice. There are only two quasi zero-energy modes E10 and E11 and two extended bulk bands. Modes E10 and E11 are located inside the bandgap and decouple from the bulk bands, which promotes topological protection. a.u., arbitrary units. (c) Spatial distribution with combined local density of states (LDOS) for the quasi zero-energy modes E10 and E11 (upper line) marked by red in (b) and bulk modes (bottom line) marked by gray in (b).
    Experimental setup and intensity distributions of pump light. (a) Experimental setup for generation, filtering, and evolution measurement of nonclassical light. The input ports can be switched. DM, dichroic mirror; MCCM, multi-channel coincidence module. (b) Simulated intensity distributions of the pump light from ports 1, 10, and 20. The evolution distance is marked in white. (I), (II), and (III) show the experimentally measured intensity distributions from three input channel ports at 5 mm, 20 mm, and 35 mm evolution distances, respectively. The protected states from ports 1 and 10 always maintain localization as the propagation distance increases, while the unprotected state from port 20 diffuses over the lattice. The intensity distribution is normalized to its maximum.
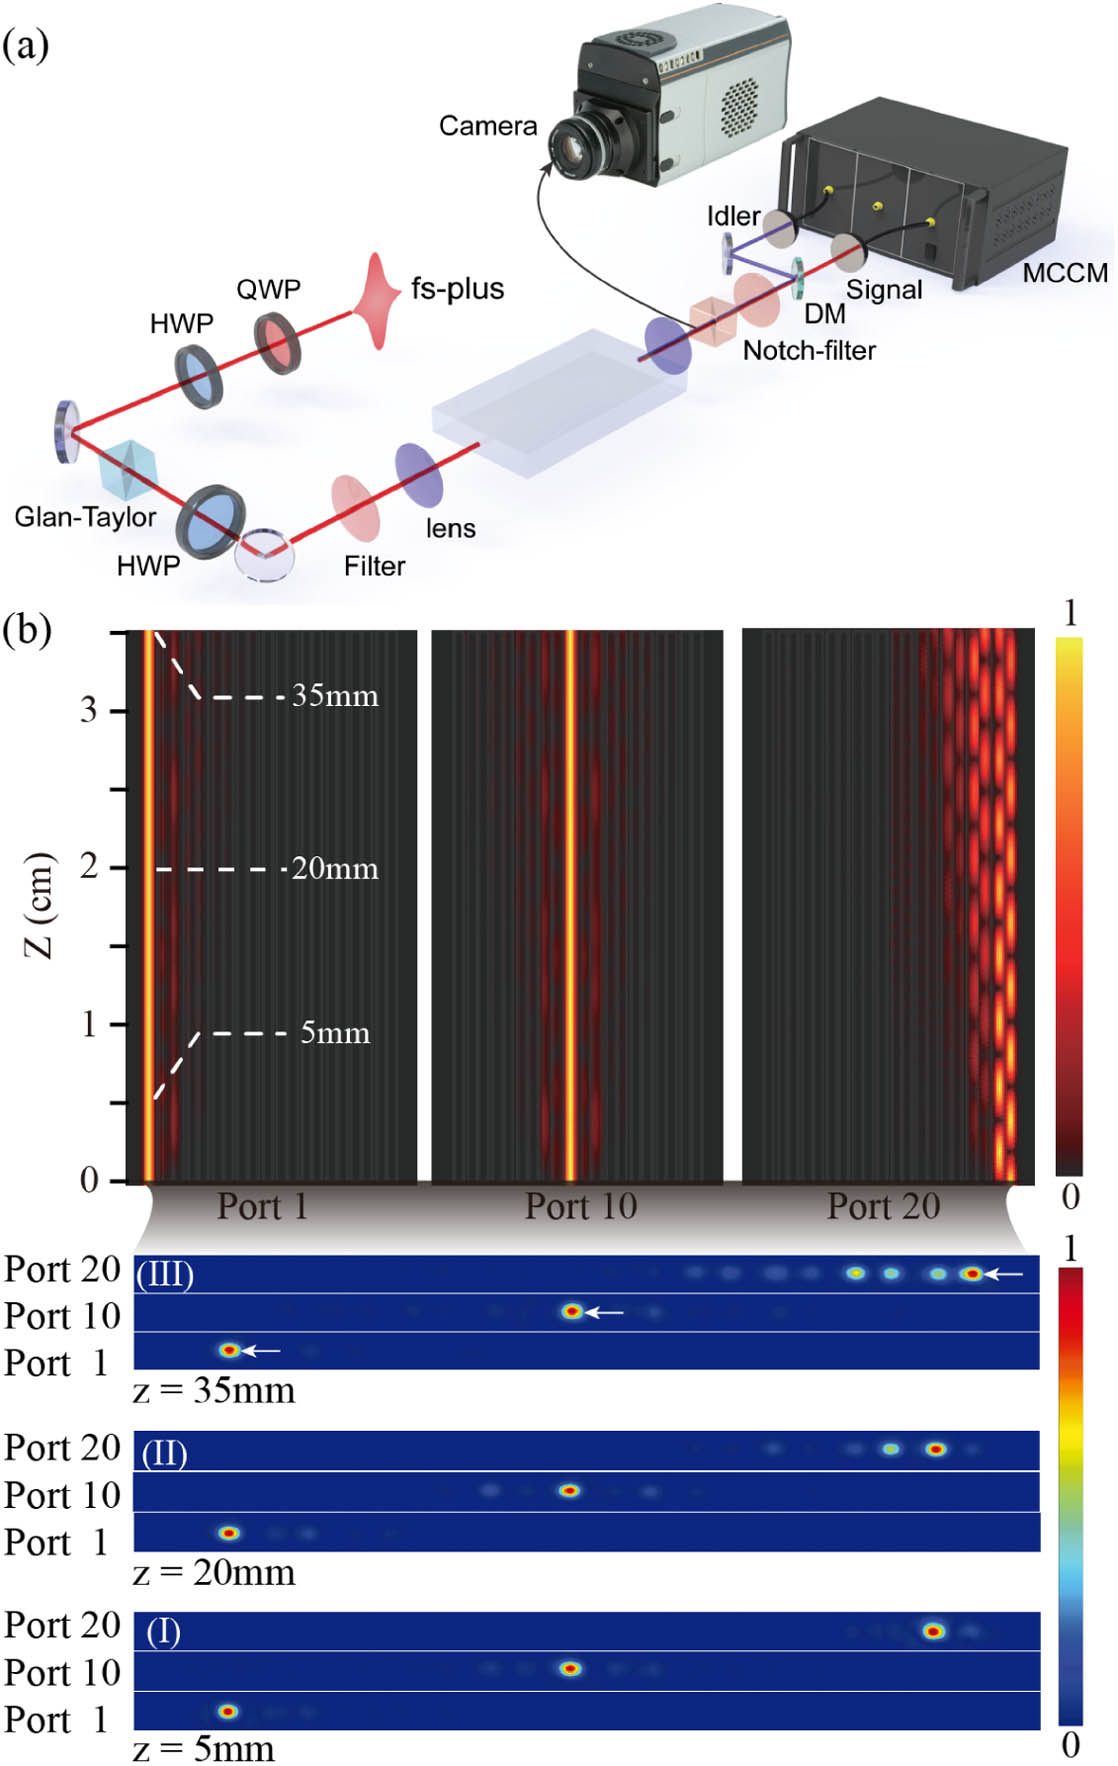
    Fig. 2. Experimental setup and intensity distributions of pump light. (a) Experimental setup for generation, filtering, and evolution measurement of nonclassical light. The input ports can be switched. DM, dichroic mirror; MCCM, multi-channel coincidence module. (b) Simulated intensity distributions of the pump light from ports 1, 10, and 20. The evolution distance is marked in white. (I), (II), and (III) show the experimentally measured intensity distributions from three input channel ports at 5 mm, 20 mm, and 35 mm evolution distances, respectively. The protected states from ports 1 and 10 always maintain localization as the propagation distance increases, while the unprotected state from port 20 diffuses over the lattice. The intensity distribution is normalized to its maximum.
    Performance of topological protection for the generated photon pairs. (a) Evolution of the signal photons generated with pump in different input ports. (b) Evolution of the idler photons generated with pump in different input ports. (c) Cross-correlations gsi2(0) with different input ports 1, 10, and 20 at different propagation distances from 5 mm to 35 mm with a step of 5 mm. The pump power is 1 mW with the integration time of 50 s. Cross-correlations gsi2(0) of channel ports 1 and 10 are depicted in green and red, respectively, with high values, which demonstrates the topological protection of FWM. Cross-correlation gsi2(0) in port 20 is depicted in blue, with the corresponding values being five times lower than the protected states from ports 1 and 10.
    Fig. 3. Performance of topological protection for the generated photon pairs. (a) Evolution of the signal photons generated with pump in different input ports. (b) Evolution of the idler photons generated with pump in different input ports. (c) Cross-correlations gsi2(0) with different input ports 1, 10, and 20 at different propagation distances from 5 mm to 35 mm with a step of 5 mm. The pump power is 1 mW with the integration time of 50 s. Cross-correlations gsi2(0) of channel ports 1 and 10 are depicted in green and red, respectively, with high values, which demonstrates the topological protection of FWM. Cross-correlation gsi2(0) in port 20 is depicted in blue, with the corresponding values being five times lower than the protected states from ports 1 and 10.
    Experimental verification of topological protection for squeezed light. The squeezing parameters in ports 1, 10, and 20 are depicted in deep red, red, and blue, accordingly. The values of the squeezing parameters are more uniform and higher in two protected cases compared with unprotected port 20. The variance among three topological channels is different since unprotected port 20 fluctuates in a wider range. The inset shows the average fluctuation from each port. Compared to the results of the other two channel ports, channel port 20 is unprotected.
    Fig. 4. Experimental verification of topological protection for squeezed light. The squeezing parameters in ports 1, 10, and 20 are depicted in deep red, red, and blue, accordingly. The values of the squeezing parameters are more uniform and higher in two protected cases compared with unprotected port 20. The variance among three topological channels is different since unprotected port 20 fluctuates in a wider range. The inset shows the average fluctuation from each port. Compared to the results of the other two channel ports, channel port 20 is unprotected.
    Experimental schematic of measuring the heralded second-order correlation gH(2)(0).
    Fig. 5. Experimental schematic of measuring the heralded second-order correlation gH(2)(0).
    Sketch of lattices for topological protection of squeezed light. There are 20 sites and 10 unit cells in the lattice. The red line marks the large spacing 9 μm with weak coupling of 0.3 mm−1, while the blue line marks the small spacing 7 μm with strong coupling of 0.8 mm−1.
    Fig. 6. Sketch of lattices for topological protection of squeezed light. There are 20 sites and 10 unit cells in the lattice. The red line marks the large spacing 9 μm with weak coupling of 0.3  mm1, while the blue line marks the small spacing 7 μm with strong coupling of 0.8  mm1.
    Verification of topological protection effect provided by topological modules. We design two topological structures containing ports 1 and 10 from the main text, and a module containing port 20 is considered as a comparison. These modules are embedded into equally spaced arrays (d=7 μm, d=8 μm, and d=9 μm) to confirm the robustness and validity of topological protection. (a)–(c) Waveguide arrays inserted into different topological modules, namely, ports 1, 10, and 20. (d)–(f) Simulation result of the field distributions using three modules.
    Fig. 7. Verification of topological protection effect provided by topological modules. We design two topological structures containing ports 1 and 10 from the main text, and a module containing port 20 is considered as a comparison. These modules are embedded into equally spaced arrays (d=7  μm, d=8  μm, and d=9  μm) to confirm the robustness and validity of topological protection. (a)–(c) Waveguide arrays inserted into different topological modules, namely, ports 1, 10, and 20. (d)–(f) Simulation result of the field distributions using three modules.
    Estimation of the mode field diameter. The intensity distributions of the light spots are extracted from the CCD data and fitted by 2D Gaussian functions. The beam diameters in x and y directions are calculated at the 1/e2 peak intensity points. We determine the scale of the figure by comparing the separation in pixel numbers and real waveguides. The final estimated results of horizontal and vertical field diameters are (5.466±0.389) μm and (5.207±0.217) μm, respectively.
    Fig. 8. Estimation of the mode field diameter. The intensity distributions of the light spots are extracted from the CCD data and fitted by 2D Gaussian functions. The beam diameters in x and y directions are calculated at the 1/e2 peak intensity points. We determine the scale of the figure by comparing the separation in pixel numbers and real waveguides. The final estimated results of horizontal and vertical field diameters are (5.466±0.389)μm and (5.207±0.217)μm, respectively.
    Measured spectra of signal and idler photons.
    Fig. 9. Measured spectra of signal and idler photons.
    Ruo-Jing Ren, Yong-Heng Lu, Ze-Kun Jiang, Jun Gao, Wen-Hao Zhou, Yao Wang, Zhi-Qiang Jiao, Xiao-Wei Wang, Alexander S. Solntsev, Xian-Min Jin. Topologically protecting squeezed light on a photonic chip[J]. Photonics Research, 2022, 10(2): 456
    Download Citation