
K. D. Leake, A. R. Hawkins, H. Schmidt, "All-optical particle trap using orthogonally intersecting beams [Invited]," Photonics Res. 1, 47 (2013)
- Photonics Research
- Vol. 1, Issue 1, 47 (2013)
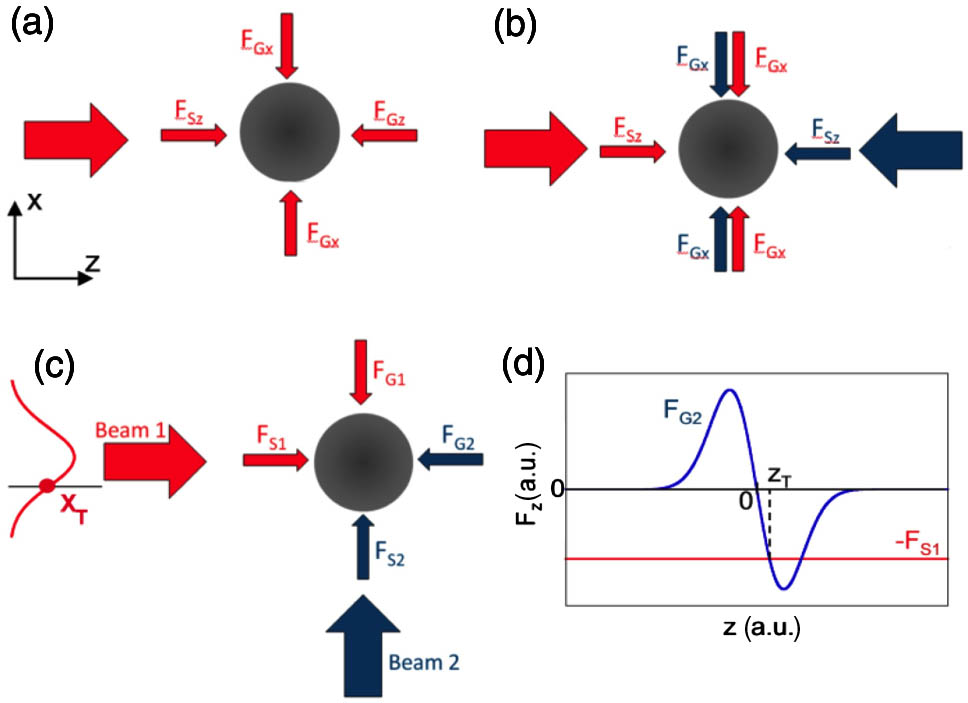
Fig. 1. (a) Single-beam tweezer trap (F G F S z x z T
![Analytically calculated forces on microbead in identical collimated beams. (a) Gradient force along z from Beam 2 and scattering force along x from Beam 1 versus transverse coordinate; curves need to intersect between the origin and location of maximum gradient force to form a stable trap [locations of maximum gradient and maximum scattering force used for (b) are shown with green arrows]. (b) Particle size dependence of forces at relevant points (symbols) and fits with second-order polynomial (lines).](/richHtml/prj/2013/1/1/01000047/img_002.jpg)
Fig. 2. Analytically calculated forces on microbead in identical collimated beams. (a) Gradient force along z x
Fig. 3. (a) Calculated particle trajectory exhibiting trapping at beam intersection (all dimensions to scale), (b) total force at the beam intersection, trapping point (black), w 0 w 0 x z
Fig. 4. (a) Calculated potential profile along the direction of Beam 1 (z 7 ) for a given particle size, and the line shows the linear fit.


Set citation alerts for the article
Please enter your email address

© Copyright 2018-2021 | Chinese Laser Press. All Rights Reserved 沪ICP备15018463号-20