
Yanjun WANG, Baosheng WU, Deyu ZHONG. Simulating cross-sectional geometry of the main channel in response to changes in water and sediment in Lower Yellow River[J]. Journal of Geographical Sciences, 2020, 30(12): 2033
- Journal of Geographical Sciences
- Vol. 30, Issue 12, 2033 (2020)
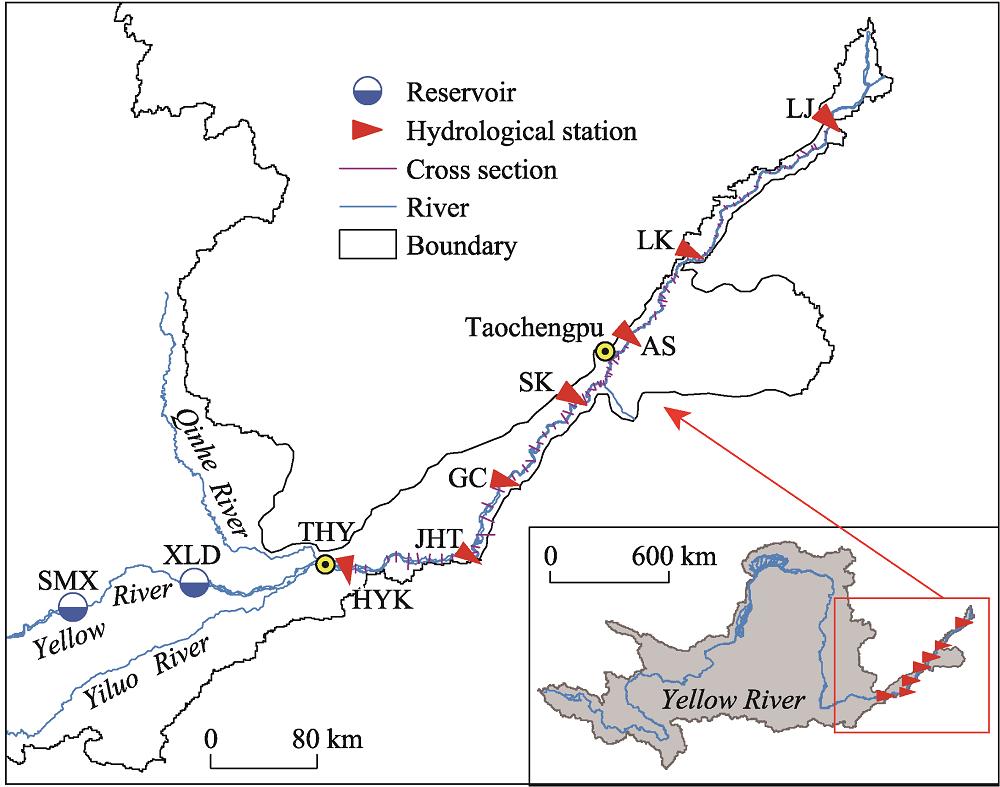
Fig. 1. Study area of the Lower Yellow River with seven hydrological stations: Huayuankou (HYK), Jiahetan (JHT), Gaocun (GC), Sunkou (SK), Aishan (AS), Luokou (LK), and Lijin (LJ)
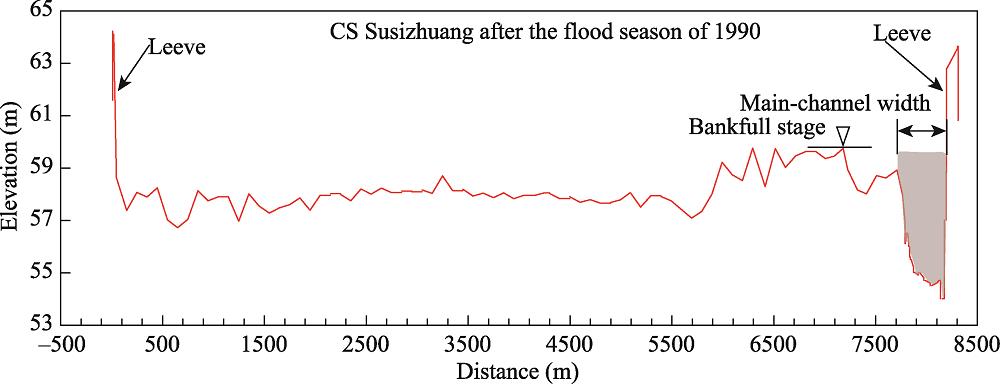
Fig. 2. Typical cross-sectional profile of Susizhuang measured after the flood season of 1990
Fig. 3. Temporal changes in water and sediment conditions at Huayuankou Station
Fig. 4. Annual average values of cross-sectional parameters of the main channel in different reachesNote: HJ (HYK-JHT), JG (JHT-GC), GS (GC-SK), SA (SK-AS), AL (AS-LK), LL(LK-LL)
Fig. 5. Temporal changes in relative cross-sectional parameters of the main channel in different reaches
Fig. 6. The relationships between area of the main channel with moving average annual discharge for the past 4 years, and SSC in different reaches
Fig. 7. The relationships between width of the main channel with annual moving average discharge for the previous 4 years, and SSC in different reaches
Fig. 8. The relationships between the depth of the main channel with annual moving average discharge for the previous 4 years, and SSC in different reaches
Fig. 9. The relationships between the cross-sectional geomorphic coefficient of the main channel with annual moving average discharge for the previous 4 years, and SSC in different reaches
Fig. 10. Comparison between computed and measured main channel area in different reaches
Fig. 11. Comparison between the computed and the measured main channel widths in different reaches
Fig. 12. Comparison between the computed and the measured main channel depths in different reaches
Fig. 13. Comparison between the computed and the measured main channel geomorphic coefficients in different reaches
Fig. 14. Downstream changes in exponents a and b of the main channel cross-sectional parameters
Fig. 15. Changes in the weighs of the previous water and sediment conditions to the cross-sectional parameters of the main channel downstream
|
Table 1.
Statistics of incoming water and sediment at Huayuankou Station in different periods
| ||||||||||||||||||||||||||||||||||||||||||||||||||||||||||||||||||||||||||||||||||||||||||||||||||||||||||||||||||||||||
Table 2.
Values of the coefficient in Equation (4) for the main channel cross-sectional parameters in different reaches

Set citation alerts for the article
Please enter your email address
© Copyright 2018-2021 | Chinese Laser Press. All Rights Reserved 沪ICP备15018463号-20