Yanjun WANG, Baosheng WU, Deyu ZHONG. Simulating cross-sectional geometry of the main channel in response to changes in water and sediment in Lower Yellow River[J]. Journal of Geographical Sciences, 2020, 30(12): 2033
Copy Citation Text
To understand the non-equilibrium morphological adjustment of a river in response to environmental changes, it is essential to (i) accurately identify how past conditions of water and sediment have impacted current morphological adjustment of the river, and (ii) establish a corresponding simulation for non-equilibrium conditions. Based on discharge and suspended sediment concentration (SSC) as well as 82 cross-sectional data items for the Huayuankou-Lijin reach of the Lower Yellow River in the period 1965-2015, the process of adjustment of the geometry of the main channel (area, width, depth, and geomorphic coefficient), and its responses to changes in discharge and SSC for different reaches are statistically analyzed. Following this, a delayed response model (DRM) of the geometry of the main channel subjected to variations in discharge and SSC is established using a multi-step analytical model, with the discharge and SSC as the main controlling factors. The results show that the area, width, and depth of the main channel decreased initially, then increased, decreased again, and finally increased again. These features of the geometry of the channel were positively correlated with the 4-year moving average discharge and negatively with the 4-year moving average SSC. The geomorphic coefficient for the Huayuankou-Sunkou reach exhibited a trend of decrease, whereas that of the Sunkou-Lijin reach decreased initially, then increased, decreased again, and finally increased again. Except for the Huayuankou-Gaocun reach in 1965-1999, the coefficient was negatively correlated with the 4-year moving average discharge and positively with SSC. The simulated values of the morphological parameters of the main channel for all sub-reaches obtained using the DRM agreed well with the measured values. This indicates that the DRM can be used to simulate the process of response of the cross-sectional geometry of the main channel to variations in the water and sediment. The results of the model show that the adjustment of the geometry of the main channel was affected by the discharge and the SSC at present (30%) as well as for the previous 7 years (70%). The proposed model offers insights into the mechanism whereby past water and sediment influence the current morphological adjustment of the river, and provides an effective method for predicting the magnitude and trend of the geometry of the main channel under different flow conditions.
The Lower Yellow River is a typical alluvial river. The shape of the riverbed is closely related to the incoming water and sediment. Owing to continual changes in the flow discharge and sediment load, the riverbed is changing and adjusting constantly. However, from the perspective of the average situation over a long period, rivers are generally in a state of equilibrium through self-regulation, and a certain quantitative relationship obtains between their cross-sectional geometry and characteristics of the basin. After Lacey (1921) initially proposed the regime theory, Leopold et al. (1953) applied it to rivers, and claimed that there is a simple power function relationship between the cross-sectional geometry and discharge in a quasi-equilibrium state, called hydraulic geometry. Researchers subsequently expanded their understanding of this relationship by introducing sediment-related factors and the material composition of the riverbed (Yu, 1982; Ni and Zhang, 1992; Chen and Hu, 2006). For example, Chen and Hu (2006) established a mathematical model of the evolution of the riverbed by using the formula for the minimum rate of available energy dissipation, and applied it to calculate the channel sections of the Lower Yellow River (LYR). Because these studies aimed to examine the channel geometry of alluvial rivers in equilibrium or quasi-equilibrium conditions, they did not predict the process of response of the channel geometry to disturbance owing to human activities in disequilibrium.
In recent decades, owing to the joint effects of climate change, reservoir regulation, irrigation diversion, and other human activities, the conditions of water and sediment entering the LYR have undergone significant changes. The amount of water and sediment load, the maximum peak flood, and the probability of overbank flood all obviously decreased, which had a far-reaching impact on the evolution of the riverbed downstream of the reservoir (Liu et al., 2011; Cui et al., 2014; Wei et al., 2016; Xia et al., 2016; Li et al., 2018). To this end, a group of researchers carried out a large number of quantitative studies on the law of evolution of the riverbed and the tendency of evolution of the LYR (Lu et al., 2000; Peng et al., 2010; van Maren et al., 2011; Wang et al., 2011; Sun et al., 2016; Tian et al., 2016; Wang et al., 2017). Another group of researchers initially simulated the adjustment process of the cross-sectional geometry in case of changes in water and sediment by establishing a quantitative relationship between them (Feng et al., 2005; Hu et al., 2006; Xia et al., 2014a, 2014b). For example, the quantitative relationship between variables of the cross-section, and the moving average discharge and SSC for the previous 4 years below the Gaocun reach was established (Feng et al., 2005). Hu et al. (2006) established quantitative relationships between a typical cross-sectional bankfull area, and the volume and maximum peak discharge of incoming water upstream, and between the width-to-depth ratio and the annual average coefficient of the incoming sediment. Xia et al. (2014a, 2014b) developed empirical relationships between the reach-scale bankfull discharge and channel geometry, and the moving average discharge and coefficient of incoming sediment for the previous 4 years in the LYR once the Xiaolangdi Reservoir had commenced operation.
To solve problem of certain degrees of experience and arbitrariness caused by using the moving average or the geometric average methods, the delayed response model (DRM) has been proposed based on the principle of self-regulation as well as the characteristic behaviors of delayed response and/or cumulative effects in the fluvial system. It uses the rate law to simulate morphological responses to disturbance in the fluvial system. This model can be used to represent the paths and times of relaxation for a range of morphological response-related variables regardless of their initial states (Wu, 2008a; Wu et al., 2012). The results have shown that the relevant models can simulate the temporal and spatial patterns of morphological responses of the fluvial system under a range of circumstances (Wu, 2008b; Wu et al., 2008a, 2008b, 2012; Wu and Li, 2011; Zheng et al., 2014, 2015a, 2015b, 2017; Wu and Zheng, 2015; Shao et al., 2018), including the responses of bankfull discharge and riverbed sedimentation to the changes of water and sediment, the response of elevation of Tongguan to sedimentation in the Sanmenxia Reservoir (SMXR), and the response of Lijin’s water stage to delta evolution. However, the applicability of these models to the simulations of the responses of the main channel geometry to the variations in the flow regime needs to be further tested.
Therefore, based on the measured discharge, sediment load, and cross-sectional data for the LYR from 1965 to 2015, and using the procedure to calculate the morphological parameters of the reach scale proposed by Xia et al. (2014), the adjustment of the geometry of the main channel in different sub-reaches of the LYR is analyzed, its response to the previous flow regime is discussed, and a generalized model for the quantitative simulation of its geomorphic adjustment is proposed based on the DRM proposed by Wu (2008a), where this can be used to predict the long-term trends of the main channel geometry under different conditions of incoming water and sediment.
2 Study area
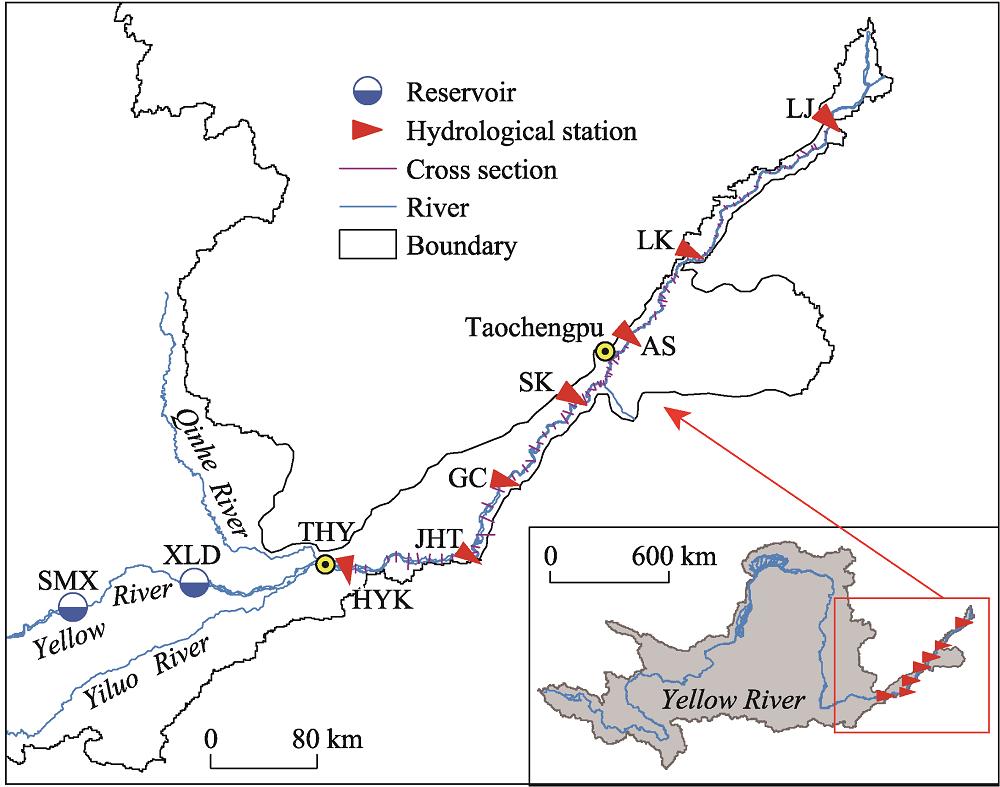
Originating from the piedmont of Mt. Bayanhar in Qinghai Province, the Yellow River drains 795,000 km2 through the Loess Plateau and Huang-Huai-Hai Plain on its way to the Bohai Sea, with a total length of 5664 km. As the source of clean water of the Yellow River, the upper reach ends at Hekouzhen in Inner Mongolia, accounting for 51.3% of the total area of the drainage basin, 54% of the water of the total basin, and only 9% of its total sediment load. Ending at Taohuayu in Henan Province, the middle reach is the main source of the sediment to the river, constituting up to 90% of the total sediment load of the basin, and cov-ering 43.3% of the total drainage area of the basin and 32% of its water. The LYR ends at Lijin (LJ), at a length of 786 km, accounting for only 3% of the total area. It has existed for more than 150 years since the great breach in 1855. It is confined by levees, and has few tributaries (Wu et al., 2010) (Figure 1). The braided reach above Gaocun (GC) is characteri-zed by wide and shallow cross-sectional profiles, frequent migration, and an extremely un-stable riverbed, with a channel length of 207 km. The transitional reach from GC to Tao-chengpu (TCP) has a relatively stable shape, with a slight migration during high floods, and a length of 165 km. The straight and slightly wandering reach from TCP to LJ has a length of 300 km, and its migration of the main channel is restricted by river training works, ac-counting for about 70% of its total length (Wang, 2009, 2010; Zheng, 2013). There are seven hydrological stations along the LYR: Huayuankou (HYK), Jiahetan (JHT), GC, Sunkou (SK), Aishan (AS), Luokou (LK), and LJ. Because TCP is close to the AS hydrological station, the SK-TCP reach and TCP-AS reach can be merged into the SK-AS reach to compare the relationship between the flow regime and the cross-sectional geometry.
Figure 1.
Study area of the Lower Yellow River with seven hydrological stations: Huayuankou (HYK), Jiahetan (JHT), Gaocun (GC), Sunkou (SK), Aishan (AS), Luokou (LK), and Lijin (LJ)
Data for daily discharge and SSC from 1965 to 2015 were collected at four mainstream hydrological stations of HYK, GC, SK, and AS. Eighty-two items of pre- and post-flood cross-sectional data from 1965 to 2015 (except pre-flood data for 2014) were also collected. These data were retrieved mainly from hydrological yearbooks (YRCC, 1965-2015) and partly from the scientific institute of the YRCC.
3.2 Method
(1) Reach-scale average morphological parameters of the main channel. Based on the measured cross-sectional data, the main channel at any selected section needed to be separated from the full cross-sectional profile. Considering that the corresponding procedure has been explained in detail in a previous study (Wang et al., 2019, 2020), the typical cross-section of Susizhuang (located 300.5 km downstream of the XLD Dam) in the transitional reach, is used as an example to briefly show the method of identifying the main channel (Figure 2). The bankfull level (Z) and width were determined according to the position and the lower elevation of the lips of the floodplain; then, the deep depth part of the bankfull zone was defined as the main channel zone, and the cross-sectional area (A) (the shaded area in Figure 2), width (W), depth (h), and geomorphic coefficient $\xi ={{{B}^{0.5}}}/{h}\;$ of the main channel under the bankfull level were calculated. Note that all parameters in the following are the cross-sectional morphological parameters of the main channel under the bankfull level.
Figure 2.
Typical cross-sectional profile of Susizhuang measured after the flood season of 1990
Owing to the large differences among the cross-sectional profiles along the LYR, the variation in its cross-sectional geometry at specific sections cannot represent the general variation in a specific reach. To compare cross-sectional adjustments in different sub-reaches, we used the procedure proposed by Xia et al. (2014) to determine the morphological parameters of the reach scale—by integrating the geometric mean based on the log transformation with a weighted average based on the spacing between consecutive sections. The corresponding formula can be written as follows:
Where ${{\overline{G}}_{mc}}$ is the geometry of the main channel of the reach scale (area, width, depth, and geomorphic coefficient); N is the number of cross-sections in the studied reach with a channel length of L; i is the sequence of the cross-sections, i = 1, 2, …, N-1; and xi is the longitudinal distance at the ith section downstream of the dam.
(2) The delayed response model. Based on the fundamental law that the rates of adjustment of the morphological variable following perturbation in alluvial channels are initially more intense and then decrease through time as a relaxed condition or a new equilibrium state is approached, Wu et al. (Wu, 2008; Wu et al., 2012) proposed the delayed response model by assuming that the rate of adjustment of any morphological variable is proportional to the difference between its value y at any time, t, and the asymptotic value ye, toward which it is adjusting. In case of continuous changes of the external disturbances, due to the lag in the adjustment of the riverbed to the perturbation, the channel geometry may not be able to approach equilibrium within a given period. However, regardless of whether the system attains equilibrium before it is again perturbed, the current state of the channel is taken as the initial condition for the next time step to determine its evolution. This reflects the influence of the preceding flow conditions on its evolution. Because the weight assigned to the influence of the initial disturbance on the current evolution is small, we can modify the multi-step DRM as follows by introducing the weight distribution of the previous flow conditions:
where yn are the morphological parameters of the main channel in the nth time step; n is the number of time steps; yei is the asymptotic value in the ith time step; λi is the weight factor for the ith time step; β is the delay rate that quantifies how rapidly y approaches ye; τ is the number of delay years; and ∆t is one year. The shape and dimensions of the channel of the LYR are formed primarily by discharge and sediment. The asymptotic value of the bankfull geometry is usually expressed as a function of discharge and the coefficient of the incoming sediment in the flood season (Shao et al., 2018; Wu and Li, 2011; Wu et al., 2008a, 2008b, 2012; Zheng et al., 2014, 2015a, 2015b, 2017). Because the flow regime in the non-flood season also affects the adjustment of the channel, the parameters of the cross-section of the main channel can be expressed in Equation (3) to identify the effect of water and sediment.
${{y}_{e}}=K{{S}^{a}}{{Q}^{b}}
$
where S (kg×m-3) and Q (m3×s-1) are the annual average discharge and SSC, respectively, and K, a, and b are parameters. Substituting Equation (3) into Equation (2), the multi-step weighted delayed response models for the morphological parameters of the cross-section of the main channel can be obtained as follows:
4.1 Flow and sediment regimes, and geometry of the main channel in LYR
The temporal variations in water and sediment at the HYK hydrological station from 1961 to 2015 can be divided into six regime stages (Figure 3 and Table 1), according to their responses to the construction of SMXR in 1960, Liujiaxia Dam in 1968, Longyangxia Dam in 1985, and Xiaolangdi Dam in 2000 as well as their varying modes of operation (Peng et al., 2006; Wang et al., 2007; Ma et al., 2012). Stage I (1961-1964): The mean annual runoff was much higher than the long-term average from 1961 to 2015, while the average sediment load and SSC were 0.79 billion tons and 13.5 kg×m-3, respectively, because of the trapping efficiency of the SMXR in the operational mode of water impoundment and sediment entrapment. Stage II (1965-1973): The mean annual runoff decreased while SSC and the sediment transport coefficient increased markedly due to the operation of the SMXR, which mitigated floods while releasing a large amount of sediment trapped in the reservoir. From 1974, the operational regime of the SMXR changed to “storing the clear water in dry season and releasing the muddy water in flood season” (Peng et al., 2006; Ma et al., 2012). Stage III (1974-1980): The incoming water and sediment load were similar to the full-period average, with considerable variation among years. Stage IV (1981-1985): The high annual runoff and low sediment loads resulted in a decrease in the sediment transport coefficient, probably due to the implementation of substantial soil conservation measures in the middle Yellow River basin (Peng et al., 2006). Stage V (1986-1999): The annual runoff and sediment load underwent a sharp reduction while SSC during floods was generally greater than 100 kg×m-3, resulting in the sediment transport coefficient being as high as 0.15 kg×s×m-6 in the flood season of 1998. Stage VI (2000-2015): The annual runoff approximated that in 1986-1999 while the annual sediment load and SSC sharply decreased to 95 million tons and to 3.73 kg×m-3, respectively, due to sediment trapping in the XLDR, a cumulative amount of up to 3.13 billion m-3 in 2015.
Figure 3.
Temporal changes in water and sediment conditions at Huayuankou Station
Based on the pre- and post-flood cross-sectional data of the 82 selected sedimentary sections below the HYK reach from 1965 to 2015, the cross-sectional geometries of the main channel (A, W, h, and $\xi ={{{B}^{0.5}}}/{h}\;$) for any selected section could be calculated based on the method of identification described above. Then, the dimensions of the main channel for six reaches—HYK-Jiahetan (JHT), JHT-GC, GC-SK, SK-AS, AS-Luokou (LK), and LK-LJ—were obtained using Equation (1). To better compare the similarities and differences in the parameters (A, W, h, and $\xi ={{{B}^{0.5}}}/{h}\;$) among the reaches, the downstream variations in the full-period averages and temporal variations in the annual relative values are shown in Figures 4 and 5, respectively, where the relative value of each variable is equal to the ratio of its absolute value to its full-period average from 1965 to 2015.
Figure 4 shows that the cross-sectional area, depth, and geomorphic coefficient of the main channel decreased downstream of the reach below HYK, but those for the reach below SK decreased slightly. The depth of the main channel decreased for the HYK-LK reach, followed by a slight increase for the LK-LJ reach.
Figure 4.
Annual average values of cross-sectional parameters of the main channel in different reachesNote: HJ (HYK-JHT), JG (JHT-GC), GS (GC-SK), SA (SK-AS), AL (AS-LK), LL(LK-LL)
Figure 5 shows that the changes of the area, width, and depth of the main channel for different reaches can be divided into five distinct stages. The range of the relative area was relatively consistent, with a rapid decrease in 1965-1973, slight increase in fluctuations in 1974-1980, quick increase in 1981-1985, a sharp decrease in 1986-1999, and a rapid increase in 2000-2015. The range of the relative width decreased downstream, where it rapidly decreased in 1965-1973, stayed unchanged in 1973-1980, rapidly increased in 1981-1985 but decreased in 1986-1999, followed by a slight increase in 2000-2015. The range of depth along the LYR increased in 1965-1999 but decreased in 2000-2015. The five successive stages were a decrease, slight increase in fluctuation, increase, rapid decrease, and rapid increase. Owing to the large differences in the rates of adjustment in the width and depth in response to changes in water and sediment, there were significant differences in variations in the geomorphic coefficient among reaches. The HYK-JHT reach experienced small fluctuations from 1965 to 1985, a significant decrease from 1986 to 2004, and a slight decrease from 2005 to 2015; except for the increase in 1981-1985, it exhibited an overall trend of decrease for the JHT-GC reach; except for the slight increase in 1977-1999, it rapidly decreased from 1974 for GC-SK reach. Sub-reaches below SK went through four stages: an increase in 1965-1973, slight decrease in 1974-1985, increase in 1986-1999, and a decrease in 2000-2015.
Figure 5.
Temporal changes in relative cross-sectional parameters of the main channel in different reaches
The adjustments of dimensions of the main channel were more consistent in the sub-reaches from HYK to GC, and among the sub-reaches below SK. The adjustment of the width for the GC-SK reach was similar to that for the HYK-GC reach, while that of the depth was more consistent with that of the SK-AS reach. Therefore, the LYR was divided into four sub-reaches: the braided reach from HYK to GC, the two transitional reaches of GC-SK and SK-AS, and the straight and slightly wandering reach from AS to LJ. The corresponding hydrological stations of flow conditions were HYK, GC, SK, and AS. The main channel geometries of the four sub-reaches were calculated using Equation (1).
4.2 Responses of the geometry of the main channel to incoming water and sediment
Owing to the rapid adjustment of the dimensions of the main channel over a year, the average pre- and post-flood parameters were taken as annual values to analyze its response to the water and sediment. The determination coefficient of the power function between the geometry of the main channel (area, width, depth, and geomorphic coefficient), and the moving average water and sediment for different numbers of preceding years τ was calculated. It first increased and reached its maximum at τ = 4 and then decreased with an increase in τ, which was consistent with the result whereby the cross-sectional bankfull geometry was most closely related to flow in the preceding 4 years including the current year (Wu et al., 2008; Wu and Zheng, 2015). Therefore, the relationships between the cross-sectional parameters with moving average discharge for the preceding 4 years and SSC are shown in Figures 6-9.
Figure 6.
The relationships between area of the main channel with moving average annual discharge for the past 4 years, and SSC in different reaches
The relationships between the cross-sectional geomorphic coefficient of the main channel with annual moving average discharge for the previous 4 years, and SSC in different reaches
(1) Area of the main channel. The relationships between the area and moving average discharge for the preceding 4 years, and SSC for four reaches are shown in Figure 6. The area was positively corelated with the discharge, that is, the larger the cross-section was, the larger the discharge. Except for the fact that the rate of increase in area with discharge after 2000 was significantly larger than that before 2000 for the HYK-GC reach, the relationship in different stages before 2000 was constant. The rate of increase in the area with discharge decreased downstream. Although the relationship between area and SSC was relatively scattered, a significant negative correlation was noted in each sub-period, that is, the larger the cross-section was, the smaller the SSC. The reason for the differences in the relationships in different sub-periods is the differences in the discharge. The rate of decrease in area with the SSC also clearly decreased downstream.
(2) Width of the main channel. The relationships between the width with moving average discharge for the preceding 4 years, and SSC are shown in Figure 7. There was a positive correlation between width and discharge, and the relationship in different sub-periods was constant. The rate of increase in width with discharge decreased downstream, and that for the HYK-GC reach was significantly larger than that in other reaches. Although the relationship between width and SSC was relatively scattered, a significant negative correlation was observed in each sub-period. The rate of decrease in width with SSC clearly decreased along the LYR.
(3) Depth of the main channel. The relationships between the depth with moving average discharge for the preceding 4 years, and SSC are shown in Figure 8. The depth was positively correlated with discharge. Under the same discharge in 2000-2015 it was significantly larger than those in different sub-periods of 1965-1999, and the differences among the sub-reaches decreased owing to the downstream propagation of continual erosion by clear water. It was negatively correlated with SSC. The relationship in different sub-periods in 1965-1999 for the HYK-GC reach and the GC-SK reach was the same, while those for the SK-AS reach and the AS-LJ reach were significantly different. The rate of increase in depth with discharge and decrease with SSC increased downstream in 1965-1999.
(4) Cross-sectional geomorphic coefficient of the main channel. The relationships between the geomorphic coefficient with the moving average discharge, and the SSC are shown in Figure 9. Except for a positive correlation for the HYK-GC reach and an insignificant correlation for the GC-SK reach in 1965-1999, a negative correlation prevailed between the coefficient and discharge. Under the same discharge in 2000-2015 for each reach it was smaller than that in 1965-1999. The relationship between it and SSC varied in different periods. Except that no significant correlation was noted for the GC-SK reach and the SK-AS reach, it was negatively correlated with SSC for the HYK-GC reach and positively correlated for the AS-LJ reach in 1965-1999; a positive correlation between them for all sub-reaches in 2000-2015 was noted. Its rate of decrease with discharge and increase with SSC decreased downstream.
Comparing the relationship between parameters of the main channel with moving average discharge and SSC, the area, width, and depth were positively correlated with discharge and negatively correlated with SSC. The rates of adjustment in area and width to variations in the flow conditions decreased downstream while those of depth increased, that is, the adjustment was dominant along the transverse direction for the HYK-GC reach, and by the vertical direction for the AS-LJ reach. The geomorphic coefficient had a negative relationship with discharge for each reach while its relationship with SSC varied significantly among reaches. This was owing to the large differences between SSC in flow and the sediment transport capacity for the HYK-GC reach. When SSC was greater than the sediment transport capacity, sediment in the flow exceeding the capacity settled, resulting in transverse siltation with a reduction in the width; on the contrary, when SSC was smaller than the sediment carrying capacity, sediment at the bottom of the riverbed was more easily eroded, resulting in an adjustment mainly by vertical deepening. Therefore, the coefficient had a negative relationship with SSC in 1965-1999 but a positive relationship in 2000-2015. The differences between SSC and the sediment transport capacity, and the peak discharge were significantly reduced after the adjustment above the GC reach and storage in a flood detention area. And the transverse adjustment for the AS-LJ reach was controlled by river training works, it was mainly adjusted in the vertical direction. The geomorphic coefficient had a positive relationship with SSC in this case (Wang et al., 2019, 2020).
4.3 Simulation of responses of geometry of the main channel to flow conditions
Based on annual average discharge and SSC in the reach inlet, and the cross-sectional morphological parameters, and by using the multi-step weighted delayed response models (Equation 4), the responses of the area, width, depth, and cross-sectional morphological coefficients of the main channel to changes in water and sediment in 1965-2015 were simulated for the four sub-reaches. To determine the number of preceding years over which the conditions had affected the adjustment of channel geometry, the coefficients of determination, R2, between the measured and the computed values, were calculated with τ = 1 to 10 years. The R2 values first increased with an increase in τ, reached their maximum values at τ = 8, and then decreased slightly at τ = 9 and 10. This indicates that the channel geometry was most closely related to discharge and SSC in the preceding 7 years. Therefore, the number of delayed years was uniformly determined to be τ = 7. This is consistent with the result whereby the channel geometry had the highest correlation with the annual moving average discharge in the last 4 years and SSC obtained in Section 4.2. Because the DRM assumes that the weight of the preceding disturbance decreased over time, and the influence of the initial disturbance for τ = 7 was the lowest. On the contrary, the moving average method assumes that the weight factor of the preceding flow conditions is the same, which amplified the weight of the initial disturbance. Below detailed the delayed response model of the main channel geometry to the previous 8 years’ discharge and SSC (both current and previous 7 years’).
(1) Area of the main channel. The DRM of the areas for the HYK-GC, GC-SK, SK-AS, and AS-LJ reaches were obtained according to Equation (4) by using non-linear regression analysis. The parameters of Equation (4) are explained in Table 2. The calculated values of the area were in good agreement with the measured values, as shown in Figure 10. The R2 were 0.89, 0.86, 0.89, and 0.94 for the HYK-GC, GC-SK, SK-AS, and AS-LJ reaches, respectively; the exponents a of discharge along the LYR were 1.34, 1.28, 0.97, and 0.71, respectively; and the exponents b of SSC were -0.40, -0.38, -0.21, and -0.17, respectively. The parameter a was clearly larger than the absolute value of b, which means that the rates of adjustment of the area to variations in discharge were greater than those to changes in SSC. The delay rates β were 0.42, 0.4, 0.37, and 0.35, respectively, and slightly decreased downstream.
Figure 10.
Comparison between computed and measured main channel area in different reaches
(2) Width of the main channel. The DRM for the widths was obtained according to Equation (4), and the parameters are shown in Table 2. The observed values are compared with the calculated values in Figure 11. Except for the relatively large differences between them in certain years, the agreement was good for most years. The R2 values for the HYK-GC, GC-SK, SK-AS, and AS-LJ reaches were 0.86, 0.86, 0.8, and 0.94, respectively, and the exponents a were 1.5, 0.93, 0.57, and 0.32, respectively. The exponents b were -0.12, -0.04, -0.02, and 0.04, respectively. The values of a were clearly larger than absolute value of b, implying that the rates of adjustment of the width to changes in discharge were significantly greater than those to changes in SSC. The delay rates β were 0.35, 0.34, 0.34, and 0.25, respectively, and slightly decreased downstream.
Reach
K
a
b
β
R2
K
a
b
β
R2
Main channel area A
Main channel width W
HYK-GC
0.69
1.34
-0.40
0.42
0.89
0.05
1.50
-0.12
0.35
0.86
GC-SK
0.75
1.28
-0.38
0.40
0.86
1.13
0.93
-0.04
0.34
0.86
SK-AS
4.40
0.97
-0.21
0.37
0.89
11.12
0.57
-0.02
0.34
0.80
AS-LJ
23.35
0.71
-0.17
0.35
0.94
42.87
0.32
0.04
0.24
0.94
Main channel depth h
Cross-sectional geomorphic coefficient $\xi $
HYK-GC
12.08
-0.13
-0.31
0.27
0.90
0.01
0.94
0.25
0.11
0.87
GC-SK
0.64
0.36
-0.34
0.42
0.79
1.09
0.15
0.36
0.12
0.63
SK-AS
0.38
0.42
-0.21
0.42
0.88
10.26
-0.18
0.26
0.25
0.62
AS-LJ
0.45
0.43
-0.23
0.45
0.86
14.53
-0.29
0.30
0.31
0.71
Table 2.
Values of the coefficient in Equation (4) for the main channel cross-sectional parameters in different reaches
(3) Depth of the main channel. The DRM of the depth was calculated according to Equation (4), and the parameters are shown in Table 2. Comparisons between the measured and the calculated values are shown in Figure 12, where the computed values were in good agreement with the measured values. The R2 for the HYK-GC, GC-SK, SK-AS, and AS-LJ reaches were 0.9, 0.79, 0.88, and 0.86, respectively, the exponents a were -0.13, 0.36, 0.42, and 0.43, respectively, and the exponents b were -0.31, -0.34, -0.21, and -0.23, respectively. It is clear that |a| was significantly smaller than |b| for the HYK-GC reach, |a| was close to |b| for the GC-SK reach, and |a| was higher than |b| for the SK-AS and AS-LJ reaches. This indicates that the rates of adjustment of the depth to changes in discharge were significantly lower than those to changes in SSC for the HYK-GC reach, and were higher for the SK-AS, and AS-LJ reaches. The delay rates β were 0.27, 0.42, 0.42, and 0.45, respectively, and slightly increased downstream.
Figure 12.
Comparison between the computed and the measured main channel depths in different reaches
(4) Cross-sectional geomorphic coefficient of the main channel. According to Equation (4), the DRM of the geomorphic coefficient was obtained, and its parameters are shown in Table 2. Comparisons between the measured and the calculated values are shown in Figure 13. For the HYK-GC reach, the computed values were in good agreement with the measured values at R2 = 0.87. For the GC-SK and SK-AS reaches, the calculated values reflected the overall trend but failed to simulate the fluctuation: the values of R2 were 0.63 and 0.62, respectively. The computed values were generally in good agreement with the measured values for the AS-LJ reach, with R2 = 0.71. The exponents a were 0.94, 0.15, -0.18, and -0.29, respectively, and the exponents b were 0.25, 0.36, 0.26 and 0.3, respectively. It is clear that a was significantly greater than b for the HYK-GC reach, smaller than b for the GC-SK reach, and |a| was slightly smaller than |b| for the SK-AS and AS-LJ reaches. This indicates that its rates of adjustment to changes in discharge were clearly greater than those to changes in SSC for the HYK-GC reach, but smaller than those for the GC-SK reach. The delay rates of β were 0.11, 0.12, 0.25, and 0.31, respectively, and slightly increased downstream.
Figure 13.
Comparison between the computed and the measured main channel geomorphic coefficients in different reaches
The changes in exponents a and b, of the cross-sectional parameters of the main channel downstream are shown in Figure 14. It is clear that the area, width, and depth were positively correlated with the annual average discharge as reflected by the positive a, and were negatively correlated with SSC as reflected by the negative values of b. The geomorphic coefficients for the HYK-GC and GC-SK reaches were positively correlated with Q and SSC, but those for the SK-AS and AS-LJ reaches were negatively correlated with Q and positively correlated with SSC. These are identical to the relationships between the geometric variables with annual moving average discharge for the previous 4 years, and SSC as detailed in Section 4.2. In addition, the exponent a of the area, width, and cross-sectional geomorphic coefficient decreased downstream while that of the depth increased. This shows that the response rates of the area, width, and cross-sectional geomorphic coefficient to the discharge decreased downstream, but that of the depth increased. This is in line with the facts that the channel in the braided reach is mainly adjusted in the transverse direction due to the relatively wide and shallow cross-sectional shape and relatively large channel slope; while the channel in the straight and slightly wandering reach is mainly adjusted in the vertical direction due to the relatively stable river bank and the constraint of the river training works (Wang et al., 2020). The area, width, and depth were negatively correlated with SSC, but the cross-sectional geomorphic coefficient was positively correlated with it. The absolute values of the exponent b for the four variables all decreased downstream, mainly because the adjustment of the supersaturated or unsaturated sediment flow was mainly concentrated in the braided reach above Gaocun. After a certain distance, flow was saturated in the reach below Gaocun. Therefore, the results of the simulation of the DRM for the morphological variables were consistent with the law of adjustment of the geometry of the main channel, thus validating the representativeness of the proposed model.
Figure 14.
Downstream changes in exponents <italic>a</italic> and <italic>b</italic> of the main channel cross-sectional parameters
Owing to the quantitative relationship among the variables of the geometry of the main channel—that is, the area was equal to the product of its width and depth, A = W * h, the geomorphic coefficient $\xi ={{{W}^{0.5}}}/{h}\;$, it can be theoretically concluded that the coefficient of area was equal to the product of the coefficients of width and depth, KA = KW * Kh, the exponent of area was equal to the sum of the exponents of width and depth, aA = aW * ah, bA = bW * bh, and the coefficients ${{K}_{\xi }}={K_{W}^{0.5}}/{{{K}_{h}}}\;$ and ${{a}_{\xi }}={{{a}_{W}}}/{2-{{a}_{h}}}\;$, ${{b}_{\xi }}={{{b}_{W}}}/{2-{{b}_{h}}}\;$. Table 2 shows that the parameters satisfied the above relationship, which further validates the rationality and consistency of the results of the simulation of the proposed model.
The relationship between changes in the weighs of the current and the past 7 years of water and sediment, and the parameters in the current year are shown in Figure 15, based on the delay rate β of the proposed model. It is clear that the weighs of influence of the flow conditions in the current year to the area of HYK-GC, GC-SK, SK-AS and AS-LJ reaches are 36%, 34%, 33% and 31%, respectively; those for the width are 31%, 31%, 31% and 25%, respectively; those for the depth are 27%, 36%, 36% and 37%, respectively; those for the geomorphic coefficient are 18%, 18%, 26% and 29%, respectively. On average, the ratio of the weight of flow conditions in the current year to adjustments in the cross-section was 30%, that is, the cumulative effect of the conditions of water and sediment in the previous 7 years was 70%. The delayed 1, 2, and 3 years contribute about 20%, 15% and 11% respectively; while the lag years τ > 3, the contribution was smaller than 10%. Spatially, the weights of influence in the current year to the area and width slightly decreased along the LYR, but that to the depth clearly increased. This was significantly smaller for the HYK-GC reach than its lower reaches. The weights of influence of flow conditions in the current year to the geomorphic coefficient also increased along the river, which was obviously larger for the SK-AS and AS-LJ reaches than its upstream reaches. Downstream variations of delay rate β of width are consistent with the facts that the channel is adjusted mainly by narrowing or widening in the braided reach but is adjusted by deepening or silting in the straight and slightly wandering (Wang et al., 2020). This further validates the reliability of the delayed response model established in this paper.
Figure 15.
Changes in the weighs of the previous water and sediment conditions to the cross-sectional parameters of the main channel downstream
(1) Due to variations in water and sediment as well as corresponding variations in phases of the erosion and deposition of the main channel in the Lower Yellow River since 1965, the range of the morphological variables of the geometry of the main channel downstream of it at different stages shows that the area of the main channel remained relatively uniform, its width decreased, and its depth increased before 2000 and decreased after 2000. The area, width, and depth were found to be positively correlated with a 4-year moving average discharge and negatively correlated with SSC. Except for the HYK-GC reach from 1965 to 1999, the geomorphic coefficient was negatively correlated with the 4-year moving average discharge and positively correlated with SSC.
(2) The DRM of the area, width, depth, and cross-sectional geomorphic coefficient of the main channel in the LYR in the current year and for the previous 7 years was established. The corresponding calculated values of the morphological parameters of all sub-reaches were in good agreement with the measured values, which indicates that the DRM can adequately simulate the response adjustment of the cross-sectional geometry of the main channel to variations in water and sediment. This can be applied to predict the paths of relaxation and channel geometries under different conditions of water and sediment.
(3) The results of the proposed model showed that the corresponding weights of influence of flow conditions in the current year and the previous 7 years to the geometry of the main channel were 30% and 70%, respectively. This revealed the important effect of past water and sediment on the present morphological adjustments. However, because the adjustment of the channel geometry in the LYR was affected by the incoming water and sediment as well as such factors as the base level of erosion, it is necessary to investigate the morphological adjustment of the river to this to improve the DRM proposed in this paper.
References
[1] Chen XJ, Hu CH. Regime theory on river bed evolution and its application in the Lower Yellow River. Journal of Sediment Research, 3, 14-22(2006).
[2] Cui BL, Chang XL, Shi WY. Abrupt changes of runoff and sediment load in the lower reaches of the Yellow River, China. Water Resources, 41, 252-260(2014).
[3] Feng PL, Liang ZY, Huang JC et al. Study on relation between the change of channel form and the series of water and sediment in the Lower Yellow River. Journal of Sediment Research, 66-74(2005).
[4] Hu CH, Chen JG, Liu DB et al. Studies on the features of cross section’s profile in the Lower Yellow River under the conditions of variable incoming water and sediment. Journal of Hydraulic Engineering, 37, 1283-1289(2006).
[5] LaceyG. Stable channels in alluvium. Proceedings of the Institution of Civil Engineers, 229, 259-292(1929).
[6] Leopold LB, MaddockT. The hydraulic geometry of stream channels and some physiographic implications. U.S. Geological Survey Professional Paper, 252(1953).
[7] Li XN, Zhong DY, Zhang YJ et al. Wide river or narrow river: Future river training strategy for Lower Yellow River under global change. International Journal of Sediment Research, 33, 271-284(2018).
[8] LiuF, Chen SL, PengJ et al. Temporal variability of water discharge and sediment load of the Yellow River into the sea during 1950-2008. Journal of Geographical Sciences, 21, 1047-1061(2011).
[9] Lu ZC, Chen SF, ChenH. The evolutionary tendency forecast of channel morphology and river state of the wandering braided rivers in the Lower Yellow River. Acta Geographica Sinica, 55, 729-736(2000).
[11] Ni JR, ZhangR. Methods and their relationships in studies of regime relations. Acta Geographica Sinica, 47, 368-375(1992).
[12] Pan XD, LiY, Zhang XH et al. The Fluvial Process in the Lower Yellow River after Completion of Sanmenxia Reservoir(2006).
[13] PengJ, Chen SL, LiuF et al. Erosion and siltation processes in the Lower Yellow River during different river courses into the sea. Acta Geographica Sinica, 65, 613-622(2010).
[14] Shao WW, Wu BS, Wang YJ et al. Simulation of sedimentation processes in dry and wet seasons in the Xiaobeiganliu reach of the Yellow River. Acta Geographica Sinica, 73, 880-892(2018).
[15] Sun ZY, Wang WZ, LiY et al. Can the narrowing of the Lower Yellow River by regulation result in non-siltation and even channel scouring?. Journal of Geographical Sciences, 26, 1337-1348(2016).
[16] Tian SM, Wang WH, Xie BF et al. Fluvial processes of the downstream reaches of the reservoirs in the Lower Yellow River. Journal of Geographical Sciences, 26, 1321-1336(2016).
[17] van Maren DS, YangM, Wang ZB. Predicting the morphodynamic response of silt-laden rivers to water and sediment release from reservoirs: Lower Yellow River, China. Journal of Hydraulic Engineering, 137, 90-99(2011).
[18] Wang HJ, WuX, Bi NS et al. Impacts of the dam-orientated water-sediment regulation scheme on the lower reaches and delta of the Yellow River (Huanghe): A review. Global and Planetary Change, 157, 93-113(2017).
[19] Wang SJ. Analysis of effect of water and sediment load and evolution trend of the different channel patterns in the lower Yellow River. Acta Sedimentologica Sinica, 27, 1163-1171(2009).
[20] Wang SJ. Comparison of depositional dynamics among the braided, meandering, and straight channel reaches in the lower Yellow River. Acta Sedimentologica Sinica, 28, 307-313, 330(2010).
[21] Wang SJ, Li YK. Channel variations of the different channel pattern reaches in the Lower Yellow River from 1950 to 1999. Quaternary International, 244, 238-247(2011).
[22] Wang YJ, Wu BS, Shen GQ. Adjustment in the main-channel geometry of the Lower Yellow River before and after the operation of the Xiaolangdi Reservoir from1986 to 2015. Acta Geographica Sinica, 74, 2411-2427(2019).
[23] Wang YJ, Wu BS, Zhong DY. Adjustment in main-channel geometry of the Lower Yellow River before and after the operation of the Xiaolangdi Reservoir from 1986 to 2015. Journal of Geographical Sciences, 30, 468-486(2020).
[25] Wei YH, Jiao JY, Zhao GJ et al. Spatial-temporal variation and periodic change in streamflow and suspended sediment discharge along the mainstream of the Yellow River during 1950-2013. Catena, 140, 105-115(2016).
[26] Wu BS. Delayed response model for fluvial processes of alluvial rivers (I): Model development. Journal of Sediment Research, 1-7(2008).
[27] Wu BS. Delayed response model for fluvial processes of alluvial rivers (Ⅱ): Model applications. Journal of Sediment Research, 30-37(2008).
[28] Wu BS, Li LY. Delayed-response model for bankfull discharge predictions in the Yellow River. International Journal of Sediment Research, 26, 445-459(2011).
[29] Wu BS, Wang GQ, Xia JQ et al. Response of bankfull discharge to discharge and sediment load in the Lower Yellow River. Geomorphology, 100, 366-376(2008).
[30] Wu BS, Xia JQ, Fu XD et al. Effect of altered flow regime on bankfull area of the Lower Yellow River, China. Earth Surface Processes and Landforms, 33, 1585-1601(2008).
[31] Wu BS, Zhang YF, Shen GQ et al. Study on the Conditions of Water and Sediment to Maintain the Stable Main Channel in the Yellow River(2010).
[32] Wu BS, ZhengS. Delayed Response Theory and Applications for Fluvial Processes(2015).
[33] Wu BS, ZhengS, Colin RT. A general framework for using the rate law to simulate morphological response to disturbance in the fluvial system. Progress in Physical Geography, 36, 575-597(2012).
[34] Xia JQ, Li XJ, LiT et al. Response of reach-scale bankfull channel geometry to the altered flow and sediment regime in the Lower Yellow River. Geomorphology, 213, 255-265(2014).
[35] Xia JQ, Li XJ, Zhang XL et al. Recent variation in reach-scale bankfull discharge in the Lower Yellow River. Earth Surface Processes and Landforms, 39, 723-734(2014).
[36] Xia XH, Dong JW, Wang MH et al. Effect of water-sediment regulation of the Xiaolangdi Reservoir on the concentrations, characteristics, and fluxes of suspended sediment and organic carbon in the Yellow River. Science of the Total Environment, 571, 487-497(2016).
[37] YuJ. Exploration and application of hydraulic geometry in plain river. Yangtze River, 61-67(1982).
[38] ZhengS. Study on the simulation of non-equilibrium fluvial processes. Beijing: Tsinghua University(2013).
[39] ZhengS, Tan GM, Wu BS et al. Calculation method for water stage at Lijin in response to delta evolution. Journal of Hydraulic Engineering, 46, 315-325(2015).
[40] ZhengS, Wu BS, Colin RT et al. Morphological evolution of the North Fork Toutle River following the eruption of Mount St. Helens, Washington. Geomorphology, 208, 102-116(2014).
[42] ZhengS, Wu BS, Wang KR et al. Evolution of the Yellow River Delta, China: Impacts of channel avulsion and progradation. International Journal of Sediment Research, 32, 34-44(2017).
Yanjun WANG, Baosheng WU, Deyu ZHONG. Simulating cross-sectional geometry of the main channel in response to changes in water and sediment in Lower Yellow River[J]. Journal of Geographical Sciences, 2020, 30(12): 2033