• Matter and Radiation at Extremes
  • Vol. 7, Issue 2, 026901 (2022)
E. Kh. Baksht1、a), B. A. Alekseev2, A. G. Burachenko1, A. V. Vukolov2, A. P. Potylitsyn2, V. F. Tarasenko1、2, S. R. Uglov2, and M. V. Shevelev2
Author Affiliations
  • 1Institute of High Current Electronics SB RAS, 2/3 Akademichesky Avenue, Tomsk 634055, Russia
  • 2National Research Tomsk Polytechnic University, Tomsk Polytechnic University, 30 Lenin Avenue, Tomsk 634050, Russia
  • show less
    DOI: 10.1063/5.0061100 Cite this Article
    E. Kh. Baksht, B. A. Alekseev, A. G. Burachenko, A. V. Vukolov, A. P. Potylitsyn, V. F. Tarasenko, S. R. Uglov, M. V. Shevelev. Emission of fused silica and KBr samples in the UV and visible spectral ranges under irradiation with 2.7 MeV electrons[J]. Matter and Radiation at Extremes, 2022, 7(2): 026901 Copy Citation Text show less
    Experimental schemes: (a) measurement of radiation time domain characteristics of the samples using a silicon photomultiplier (SiPM); (b) determination of the radiation spectra of the samples; (c) determination of the spatial distribution of optical emission of the samples. Key: 1, microtron; 2, collimating diaphragm; 3, sample; 4, SiPM; 5, optical fiber; 6, collecting lens; 7, spectrometer; 8, webcam.
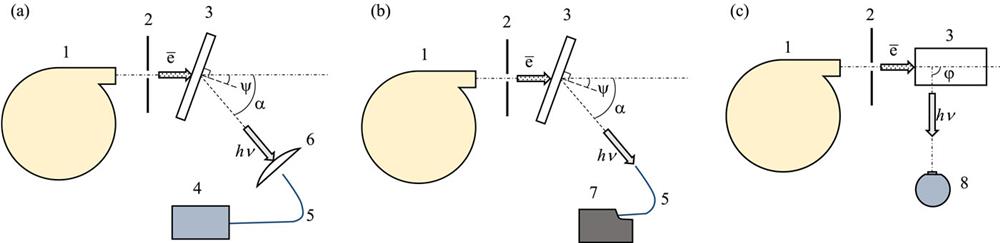
    Fig. 1. Experimental schemes: (a) measurement of radiation time domain characteristics of the samples using a silicon photomultiplier (SiPM); (b) determination of the radiation spectra of the samples; (c) determination of the spatial distribution of optical emission of the samples. Key: 1, microtron; 2, collimating diaphragm; 3, sample; 4, SiPM; 5, optical fiber; 6, collecting lens; 7, spectrometer; 8, webcam.
    GEANT4 simulation of the penetration of an electron beam into a fused silica plate of thickness 5.5 mm. The trajectories of 50 electrons are shown. The space between the diaphragm and the plate is filled with air at atmospheric pressure.
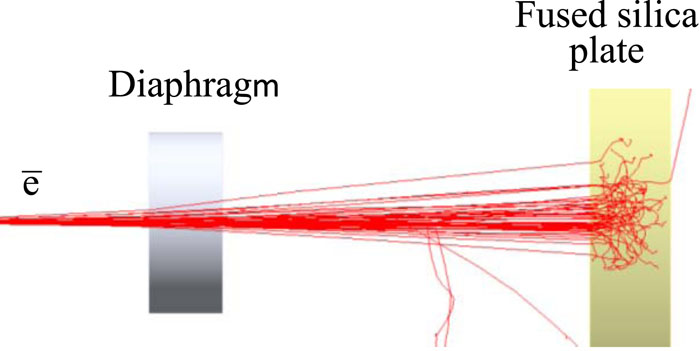
    Fig. 2. GEANT4 simulation of the penetration of an electron beam into a fused silica plate of thickness 5.5 mm. The trajectories of 50 electrons are shown. The space between the diaphragm and the plate is filled with air at atmospheric pressure.
    (a) Energy distribution of the electrons of the beam at different depths of its penetration into fused silica (indicated in millimeters). The spread in energies at a target thickness of 0 mm is determined by electron beam scattering in an air layer of thickness 40 mm. (b) Angular distribution of the electrons normalized to unity at different depths of beam penetration into fused silica. θ° is the angle between the electron beam axis and the electron velocity vector.
    Fig. 3. (a) Energy distribution of the electrons of the beam at different depths of its penetration into fused silica (indicated in millimeters). The spread in energies at a target thickness of 0 mm is determined by electron beam scattering in an air layer of thickness 40 mm. (b) Angular distribution of the electrons normalized to unity at different depths of beam penetration into fused silica. θ° is the angle between the electron beam axis and the electron velocity vector.
    Normalized waveforms of the electron beam current Ib and the intensity of optical emission USiPM of KU-1 and GE012 fused silica plates, as well as a KBr plate. All waveforms were recorded in a mode of averaging over 256 pulses.
    Fig. 4. Normalized waveforms of the electron beam current Ib and the intensity of optical emission USiPM of KU-1 and GE012 fused silica plates, as well as a KBr plate. All waveforms were recorded in a mode of averaging over 256 pulses.
    (a) Experimental radiation spectrum of a KU-1 fused silica plate with a thickness of 8 mm and the CR calculated spectrum. (b) Radiation spectrum of a KBr plate with a thickness of 4 mm (curve 1), calculated CR spectrum (curve 2), and spectral transmittance of a KBr plate (curve 3). The integration time of the spectrometer for the experimental KU-1 spectrum was 30 s, while for the experimental KBr spectrum it was 10 s. The calculated spectrum of CR for fused silica is normalized to the value of the KU-1 energy spectral density of the radiation of the plate at a wavelength of 375 nm, while for KBr it is normalized to the value of the KBr energy spectral density of the radiation of the plate at a wavelength of 300 nm.
    Fig. 5. (a) Experimental radiation spectrum of a KU-1 fused silica plate with a thickness of 8 mm and the CR calculated spectrum. (b) Radiation spectrum of a KBr plate with a thickness of 4 mm (curve 1), calculated CR spectrum (curve 2), and spectral transmittance of a KBr plate (curve 3). The integration time of the spectrometer for the experimental KU-1 spectrum was 30 s, while for the experimental KBr spectrum it was 10 s. The calculated spectrum of CR for fused silica is normalized to the value of the KU-1 energy spectral density of the radiation of the plate at a wavelength of 375 nm, while for KBr it is normalized to the value of the KBr energy spectral density of the radiation of the plate at a wavelength of 300 nm.
    (a) Experimental radiation spectra of a GE012 fused silica plate with a thickness of 2.18 mm for angles ψ = 0°, 36°, and 76°, together with calculated CR spectra. The calculated spectra are normalized to the value of the energy spectral radiation density of the GE012 sample at a wavelength of 510 nm for the corresponding angles ψ. The integration time of the spectrometer for the experimental spectra was 30 s. (b) Radiation energy of a GE012 fused silica sample in the spectral range of 300–800 nm (experiments with collimated and uncollimated electron beams), together with the calculated radiation energy for the collimated electron beam, for different values of the angle ψ. The optical fiber was installed at an angle α = 46° to the electron beam axis.
    Fig. 6. (a) Experimental radiation spectra of a GE012 fused silica plate with a thickness of 2.18 mm for angles ψ = 0°, 36°, and 76°, together with calculated CR spectra. The calculated spectra are normalized to the value of the energy spectral radiation density of the GE012 sample at a wavelength of 510 nm for the corresponding angles ψ. The integration time of the spectrometer for the experimental spectra was 30 s. (b) Radiation energy of a GE012 fused silica sample in the spectral range of 300–800 nm (experiments with collimated and uncollimated electron beams), together with the calculated radiation energy for the collimated electron beam, for different values of the angle ψ. The optical fiber was installed at an angle α = 46° to the electron beam axis.
    Photographs of (a) the uncollimated electron beam footprint on borosilicate glass of thickness h = 4 mm, at ψ = 90°, (b) optical emission of GE012 fused silica with h = 2.18 mm, at ψ = φ = 46°, (c) KU-1 with h = 8 mm, at ψ = φ = 46°, and (d) KBr with h = 4 mm, at ψ = φ = 49°. All the photographs have dimensions of 40 × 40 mm2.
    Fig. 7. Photographs of (a) the uncollimated electron beam footprint on borosilicate glass of thickness h = 4 mm, at ψ = 90°, (b) optical emission of GE012 fused silica with h = 2.18 mm, at ψ = φ = 46°, (c) KU-1 with h = 8 mm, at ψ = φ = 46°, and (d) KBr with h = 4 mm, at ψ = φ = 49°. All the photographs have dimensions of 40 × 40 mm2.
    Footprint of a diaphragmed electron beam on a KBr sample in transmitted daylight, together with graphs of the integral absorption coefficient of daylight (in arbitrary units), which characterize the distribution of the density of radiation-induced color centers in the sample in the vertical and horizontal directions passing through the center of the footprint. The distance from the collimating diaphragm to the target was 30 mm, the beam irradiation time was 15 min, and the time from irradiation to the time at which the footprint was taken was 10 min. The angle ψ = 0°.
    Fig. 8. Footprint of a diaphragmed electron beam on a KBr sample in transmitted daylight, together with graphs of the integral absorption coefficient of daylight (in arbitrary units), which characterize the distribution of the density of radiation-induced color centers in the sample in the vertical and horizontal directions passing through the center of the footprint. The distance from the collimating diaphragm to the target was 30 mm, the beam irradiation time was 15 min, and the time from irradiation to the time at which the footprint was taken was 10 min. The angle ψ = 0°.
    Photographs of the optical emission of KU-1 samples [the experimental scheme is shown in Fig. 1(c)]. (a) Sample with dimensions of 1 × 2 × 40 mm3, at φ = 90°. The direction of propagation of the electron beam is shown by the arrow. (b) Plate of diameter 60 mm and thickness 8 mm, installed perpendicular to the electron flux, at φ = 0°.
    Fig. 9. Photographs of the optical emission of KU-1 samples [the experimental scheme is shown in Fig. 1(c)]. (a) Sample with dimensions of 1 × 2 × 40 mm3, at φ = 90°. The direction of propagation of the electron beam is shown by the arrow. (b) Plate of diameter 60 mm and thickness 8 mm, installed perpendicular to the electron flux, at φ = 0°.
    Radiation energy of a KU-1 fused silica plate with a thickness of 8 mm in the spectral range of 300–800 nm for a collimated electron beam, together with the calculated radiation energy in the same spectral range under similar conditions of electron beam irradiation of fused silica plates with thicknesses of 8 and 2.18 mm for different values of the angle α. The angle ψ = 0°, and the distance from the plate to the optical fiber was 34 mm at α = 0°.
    Fig. 10. Radiation energy of a KU-1 fused silica plate with a thickness of 8 mm in the spectral range of 300–800 nm for a collimated electron beam, together with the calculated radiation energy in the same spectral range under similar conditions of electron beam irradiation of fused silica plates with thicknesses of 8 and 2.18 mm for different values of the angle α. The angle ψ = 0°, and the distance from the plate to the optical fiber was 34 mm at α = 0°.
    E. Kh. Baksht, B. A. Alekseev, A. G. Burachenko, A. V. Vukolov, A. P. Potylitsyn, V. F. Tarasenko, S. R. Uglov, M. V. Shevelev. Emission of fused silica and KBr samples in the UV and visible spectral ranges under irradiation with 2.7 MeV electrons[J]. Matter and Radiation at Extremes, 2022, 7(2): 026901
    Download Citation