
E. Kh. Baksht, B. A. Alekseev, A. G. Burachenko, A. V. Vukolov, A. P. Potylitsyn, V. F. Tarasenko, S. R. Uglov, M. V. Shevelev. Emission of fused silica and KBr samples in the UV and visible spectral ranges under irradiation with 2.7 MeV electrons[J]. Matter and Radiation at Extremes, 2022, 7(2): 026901
- Matter and Radiation at Extremes
- Vol. 7, Issue 2, 026901 (2022)
Abstract
I. INTRODUCTION
Cherenkov radiation (CR) is an important tool used in high-energy physics to detect and study both individual charged particles and their beams. It is produced when charged particles move at a speed exceeding the phase speed of light in a medium. As is well known,1,2 CR has the following main properties:
In constructing CR detectors, one or more properties of CR are used, depending on the type of the detector and the particular application.
Fused silica is one of the most commonly used radiator materials in Cherenkov detectors.3–11 It has a relatively high refractive index and a high transmittance over a wide spectral range, including the vacuum ultraviolet (VUV) region. It is radiation-resistant, and has a fairly high melting point. Owing to these properties, it can be used in the harsh environments of particle colliders,8 installations for inertial confinement fusion,3,4 and tokamaks,12,13 along with diamond. Fused silica radiators are used in time-of-flight counters for elementary particles,8,9 in systems for identification of hadrons,5,7 and for measuring the fluxes of charged particles,8,10 as well as for a number of other applications.
When charged particles pass through radiator material, along with CR, luminescence also appears. At relatively low particle energies, luminescence can be comparable to CR in intensity and can even dominate it. In this case, spectral measurements are required to select CR. To investigate this, a number of similar experiments have been carried out with electron beams with energies in the range of tens to hundreds of keV.14–18 We should also note our previous work,19 in which we carried out spectral studies of radiation from fused silica plates in the UV and visible ranges under excitation by an electron beam with an energy of 6 MeV. We demonstrated that the change in the inclination angle of a plane-parallel plate with respect to the electron beam significantly affected both the CR intensity and the radiation spectrum. At large and small inclination angles of the plate, pulsed cathodoluminescence (PCL) was recorded in the optical range of the spectrum, and the CR intensity became low.
With a decrease in the energy of the beam electrons, an increase in the PCL component of the radiation spectrum can be expected. However, with a target of sufficient thickness, the scattering of the electrons also increases. Multiple scattering of the electrons leads to emission of CR photons over a wide range of angles. This leads to an increase in the CR component of radiation spectrum at large and small inclination angles of the plate with respect to the electron beam. At sufficiently low electron energies, the total radiation spectrum can also be affected by the plate thickness. In “thin” plates, in which an insignificant part of the energy of the beam electrons is lost, it is mainly CR that will be excited. With an increase in thickness, the PCL component of the radiation spectrum will increase. The main aim of the present investigation is to evaluate the effect of electron scattering on the emission spectra of fused silica and KBr plates (KBr was selected for comparison with fused silica as a highly luminescent material). Until now, no such studies have been carried out.
II. EXPERIMENTAL SETUP AND MEASUREMENT TECHNIQUES
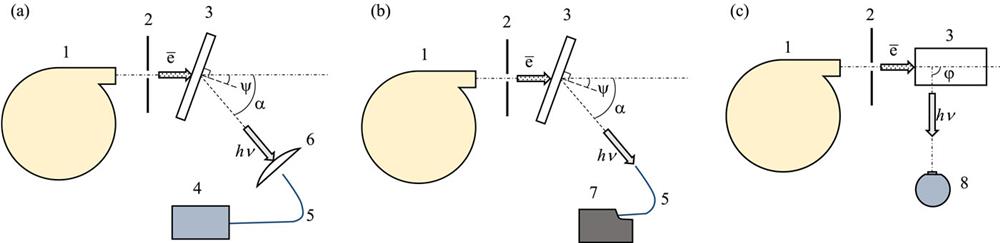
The experimental investigation of optical emission of samples under the action of an electron beam was performed on a microtron at Tomsk Polytechnic University.20 The experimental schemes are shown in Fig. 1. The electron beam from the microtron (1) was extracted through a beryllium foil with a thickness of 50 µm and a stainless steel tube with a diameter of 20 mm. The extracted beam generated optical emission in the target (3), and this was recorded according to the schemes shown in Fig. 1. Here, α is the angle between the axis of the electron beam and the end of the optical fiber (5) facing the target (3), ψ is the angle between the axis of the electron beam and the normal to the target surface, and φ is the angle between the axis of the electron beam and the optical axis of the webcam lens.
![]()
Figure 1.Experimental schemes: (a) measurement of radiation time domain characteristics of the samples using a silicon photomultiplier (SiPM); (b) determination of the radiation spectra of the samples; (c) determination of the spatial distribution of optical emission of the samples. Key: 1, microtron; 2, collimating diaphragm; 3, sample; 4, SiPM; 5, optical fiber; 6, collecting lens; 7, spectrometer; 8, webcam.
In comparison with Ref. 19, in this work, the electron energy and the current pulse duration of the beam were reduced respectively from 6 to 2.7 MeV and from 4 µs to 500 ns. One electron beam pulse consisted of 103 bunches with a duration of ∼10 ps each, and the average beam current in a pulse could reach 2.5 mA after collimation. In the experiments, electron beam pulses were applied to the target with a frequency of 50 Hz. The duration of individual electron bunches and the corresponding radiation pulses was less than the time resolution of the equipment used in these experiments. The root-mean-square deviation of the angular distribution of the electron beam of the accelerator after extraction behind the foil was σe = 6°, and when a collimating diaphragm made of lead with a hole diameter of 5 mm was installed [(2) in Fig. 1], it decreased to σe = 3.4°. The electron beam current was recorded with a Faraday cup.
In the experiments, an electron beam was used to irradiate plane-parallel plates made of GE012 fused silica with a thickness of 2.18 mm, KU-1 fused silica with a thickness of 8 mm, and KBr with a thickness of 4 mm, as well as a KU-1 sample in the form of a parallelepiped with dimensions of 10 × 20 × 40 mm3. KU-1 features high transparency within the UV and visible regions. It has no absorption bands within the 170–250 nm wavelength range. This grade does not express fluorescence as a result of UV excitation and is characterized by optical-radiation stability. It is practically free from bubbles and inclusions. GE012 has the ultra-high purity of synthetic fused silica. The choice of these grades of fused silica was due to the low intensity of PCL that they exhibit and their low absorption in the 200–800 nm wavelength range. The transmittance of both fused silica plates was more than 0.8 at a wavelength of 200 nm. The refractive indices of fused silica and KBr at the wavelength of the D-line of the sodium spectrum (589.3 nm) are 1.46 and 1.56, respectively. The radiation spectra were recorded with an Ocean Optics HR2000+ES spectrometer (wavelength range 190 nm–1.1 µm, optical resolution ∼0.9 nm FWHM) with known spectral sensitivity. https://www.oceaninsight.com/ The spectrometer was located outside the electron beam trajectory and was protected by a lead shield from ionizing radiation. This made it possible to reduce the noise in the registration of spectra. The optical emission of the samples entered the spectrometer through an optical fiber with a length of 1 m. The fiber was also protected from ionizing radiation.
The spectra were recorded in the integration mode, with an integration time of up to 30 s. To reconstruct the real spectra, the raw data obtained for each wavelength were divided by the transmittance of the optical fiber and the sensitivity of the spectrometer at this wavelength. Because the noise appeared mainly as localized spikes, the median filtering method was used.
The time dependence of the optical emission of the samples during their irradiation with an electron beam was recorded using a silicon photomultiplier (SiPM) (MicroSC/FC model) with a time resolution of 3.2 ns (the time of complete recovery of cells is 210 ns) as part of a MicroFC-SMA-60035 microchip. The microchip SiPM, like the spectrometer, was located at a distance from the electron beam trajectory. The radiation from the samples was collected by a lens on an optical fiber and applied to the SiPM. All elements of the recording system of the sample optical emission were protected from ionizing radiation.
To photograph the optical emission of the samples (including that perpendicular to the direction of the electron beam propagation), a DNS 0306ABS webcam was used.
To rotate the samples to the desired angle, as well as to position the optical fiber at a certain angle, holders and rotary mechanisms with stepper motors manufactured by Standa Ltd. were used.
To record electrical signals from the Faraday cup and SiPM, a GDS-2102 digital oscilloscope (100 MHz, 1 GS/s) manufactured by GW Instek was used.
III. SIMULATION
Simulation of the passage of the electron beam, taking account of scattering as well as generation of optical photons, was carried out using the GEANT4 program.21 In the experiments, the electron energy did not exceed 2.7 MeV, and so the passage of the charged particles through matter was simulated using the G4EmStandardPhysics_option4 standard library, which allows the simulation of low-energy physical processes. To take into account physical processes in the optical frequency range, the G4 OpticalPhysics library was used, which also includes CR. Additional information about these libraries can be found in Refs. 22 and 23. The calculation of the Vavilov–Cherenkov optical radiation in GEANT4 is based on the Tamm–Frank formula:
In the considered model, the momentum of the relativistic electron changes along the trajectory in both magnitude and direction. The number of CR photons emitted depends on the particle speed v according to Eq. (1), while the CR radiation angle in matter relative to the electron velocity vector depends on v as θCh = arccos(c/vn). Thus, the number of emitted photons, as well as the CR angle, decrease in accordance with the speed deceleration of the charged particle caused by losses in the radiator material.
In the GEANT4 model, the electron beam propagates from a point source located at a distance of 17.5 mm from the collimating diaphragm. This distance was chosen so that the angular divergence of the beam after the diaphragm corresponds to the divergence of the beam in the experiment (the standard deviation of the initial beam is σe = 3.4°). The entire space between the diaphragm and electron source, the diaphragm hole, and the space between the diaphragm and the target were filled with air at atmospheric pressure. During the passage of the electron beam to the target, its scattering in air is simulated. This scattering increases the angular divergence of the beam. During its penetration into a target, the angular distribution of the beam broadens rapidly with depth (the standard deviation of the beam σe increases).
The GEANT4 model closely replicated the experimental conditions, namely, the energy and divergence of the electron beam, the transport of the beam to the target at atmospheric pressure, the thickness of the target and its angle of rotation ψ with respect to the beam axis, the diameter of the receiving part of the radiation detector (corresponding to the diameter of the fiber core), the maximum angle of the radiation input into the detector (which was calculated from the numerical aperture of the fiber), the distance from the receiving part of the detector to the target axis, and the angle between the axis of the electron beam and the optical axis of the radiation detector. The radiation detector, designed by the GEANT4 developers, recorded the energy and photons entering it.
The limitations of the model used for our work should be noted: GEANT4 does not take into account the “diffraction blurring” of the CR radiation directionality due to changes in electron momentum during scattering.25–27
IV. RESULTS AND DISCUSSION
The passage of an electron beam through a fused silica target was investigated experimentally. It was also simulated using the GEANT4 program based on the experimental conditions.
Figure 2 shows the result of a simulation of electron beam penetration into a fused silica plate, illustrating the scattering of the electrons in the sample. The electron beam passes through air and crosses the diaphragm. After that, the electrons fall on the silica plate, where CR is generated. The detector is located behind the silica plate in accordance with the experimental configuration shown in Fig. 1. The standard deviation of the initial beam is σe = 3.4°, which corresponds to the angular width of the beam after the diaphragm.
![]()
Figure 2.GEANT4 simulation of the penetration of an electron beam into a fused silica plate of thickness 5.5 mm. The trajectories of 50 electrons are shown. The space between the diaphragm and the plate is filled with air at atmospheric pressure.
The numerical results are presented in Fig. 3. Figure 3(a) shows the change in the electron spectrum with increasing penetration depth of the beam into the sample material. At a depth of 5 mm, the number of electrons with energies less than the threshold energy for the appearance of CR in fused silica (191 keV) does not exceed 8.5%, but the total number of electrons has decreased by 16 times in comparison with the initial number, and the maximum of the energy distribution corresponds to ∼500 keV. At a depth of 5.5 mm, the number of electrons with energies less than the threshold energy for the appearance of CR in fused silica does not exceed 12%. However, the total number of electrons has decreased by almost 1000 times in comparison with the initial number, and the maximum of the energy distribution corresponds to ∼350 keV. The depth of 5 mm corresponds to the dimensions of the optical emission of the fused silica sample in the propagation direction of the electron beam (see Fig. 9).
![]()
Figure 3.(a) Energy distribution of the electrons of the beam at different depths of its penetration into fused silica (indicated in millimeters). The spread in energies at a target thickness of 0 mm is determined by electron beam scattering in an air layer of thickness 40 mm. (b) Angular distribution of the electrons normalized to unity at different depths of beam penetration into fused silica.
Figure 3(b) shows the change in the angular distributions of the electrons at different depths of penetration of the electron beam into fused silica as a result of scattering. It can be seen that already at a depth of 2 mm, the angular distribution is close to a diffuse distribution (proportional to cos2 θ, where θ is the electron scattering angle).
The experimentally measured waveforms of the beam current, as well as the intensity of optical emission of KU-1 and GE012 fused silica and KBr plates under irradiation with an electron beam are shown in Fig. 4 [the scheme of the experiment is shown in Fig. 1(a)]. The durations of the radiation pulses and beam current approximately coincide at half-maximum, which is typical of CR, but they differ in duration at the level of 0.1. The optical emission of the KBr plate has a longer duration owing to the presence of an exponential “tail” of the optical emission pulse, which can be attributed to the contribution of PCL. For all samples, there was some delay in the decay of the radiation pulse (for the KBr plate, the decay of the radiation pulse up to the beginning of the “tail”) compared with the leading edge and decay of the beam current pulse (Fig. 4). This is due to the use of the standard output of the MicroFC-SMA-60035 microchip, which delays the radiation pulse decay in accordance with a SiPM recovery time equal to 210 ns.
![]()
Figure 4.Normalized waveforms of the electron beam current
The radiation spectra for the KU-1 fused silica and KBr samples, as well as the spectral transmittance of the KBr sample, are shown in Fig. 5. For the fused silica sample, the spectral transmittance in the considered wavelength range is close to 1. The spectra were obtained when the samples were positioned at an angle to the electron beam axis [see Fig. 1(b)] so that the angle between the normal to the surface of the plate and the electron beam axis was ψ = 46° for the fused silica sample and ψ = 49° for the KBr sample.
These angles correspond to the Cherenkov emission angle θCh at CR excitation by 2.7 MeV electrons in the material of the plate. The optical fiber was located perpendicular to the surface of the sample (at angles α = 46° and α = 49° to the beam axis for the fused silica and the KBr, respectively).
![]()
Figure 5.(a) Experimental radiation spectrum of a KU-1 fused silica plate with a thickness of 8 mm and the CR calculated spectrum. (b) Radiation spectrum of a KBr plate with a thickness of 4 mm (curve 1), calculated CR spectrum (curve 2), and spectral transmittance of a KBr plate (curve 3). The integration time of the spectrometer for the experimental KU-1 spectrum was 30 s, while for the experimental KBr spectrum it was 10 s. The calculated spectrum of CR for fused silica is normalized to the value of the KU-1 energy spectral density of the radiation of the plate at a wavelength of 375 nm, while for KBr it is normalized to the value of the KBr energy spectral density of the radiation of the plate at a wavelength of 300 nm.
Figure 5(a) shows good agreement between the experimental radiation spectrum of a KU-1 sample and the spectrum of CR calculated taking into account the refractive index dispersion of fused silica and the ionization energy losses of electrons in the substance. This suggests that almost all radiation from the KU-1 sample is CR. Some of the discrepancy between the experimental and calculated spectra for wavelengths shorter than 300 nm can be explained by a decrease in the signal-to-noise ratio due to the small value of the spectral sensitivity of the spectral sensitivity of the spectrometer’s CCD-line in this wavelength range. Since the spectrum is very noisy in the range of 250–300 nm, the smoothed spectrum can reproduce the real radiation spectrum with distortions in this wavelength range.
The emission band that is clearly visible in the KBr radiation spectrum of the sample in the range from 400 to 600 nm [Fig. 5(b)] is associated with the presence of PCL in the sample. The more intense KBr optical emission made it possible to record the emission spectrum with a three-times shorter integration time (10 s) compared with KU-1. This led to an increase in the signal-to-noise ratio and avoided smoothing problems in the wavelength range of 250–300 nm. Since the KBr plate rapidly darkened when irradiated with an electron beam, owing to the formation of radiation-induced color centers, further studies were carried out mainly with fused silica targets. The fused silica retained its optical properties much better throughout the experiment compared with KBr. In previous work, fused silica showed its radiation resistance when trained by 6 MeV electrons.19
Figure 6 presents the radiation spectra of the GE012 plate when the sample is located at different angles to the electron beam axis, as well as the angular dependence of the radiation of plate energy when experiments were carried out according to the scheme shown in Fig. 1(a). Figure 6(a) shows the experimental spectra corresponding to the minimum (ψ = 0°) and maximum (ψ = 76°) rotation angles of the GE012 plate, as well as to the angle ψ = 36° at which the radiation energy entering the optical fiber is maximum [see Fig. 6(b)]. For all these inclination angles of the silica plate, there is good agreement between the experimental spectral dependences of CR in the GE012 sample and the calculated ones. Similar agreement is observed for the spectra corresponding to intermediate values of the angle ψ. This suggests that over a wide range of the inclination angle ψ (in fact, regardless of the angle), almost all the radiation from the GE012 sample is CR. This behavior of the emission spectra is associated with electron scattering, since at a sample depth of 1 mm the angular distribution of the beam electrons is already quite wide, and at a depth of 2 mm it is close to diffuse [see Fig. 3(b)]. At the same time, the electrons have energies much higher than the threshold energy for the appearance of CR [see Fig. 3(a)].
![]()
Figure 6.(a) Experimental radiation spectra of a GE012 fused silica plate with a thickness of 2.18 mm for angles
Figure 6(b) shows a maximum, which is characteristic of CR. From the experimental data, it can be seen that the radiation energy at an angle of 0° significantly exceeds that at an angle of 76°, while the theoretical results give a similar intensity at these angles. In general, the differences between the calculated and experimental dependences are associated with the fact that in the theoretical model, the CR photons are assumed to be emitted strictly at an angle θCh relative to the trajectory of motion of the electrons. As a consequence, the model does not take into account the diffraction effects arising from the finiteness of the electron trajectories, the decrease in electron speed in matter due to losses, and the changes in the direction of motion of the electrons during their scattering.25,26
Figure 7 shows photographs of the electron beam footprint and optical emission of the fused silica and KBr plates, and Fig. 8 shows the darkening of a KBr plate due to the formation of radiation-induced color centers after exposure to the collimated electron beam. The greater size of the optical emission range of the KBr sample compared with the fused silica samples in Fig. 7 can be explained by the concentration of a large part of the radiation energy in the visible region (due to the higher KBr luminescence level; see the spectra in Fig. 5), where the sensitivity of the webcam is highest. The photoluminescence of KBr under the action of the short-wave CR component in the absorption region of the material will also contribute to luminescence, when KBr operates as a wavelength shifter. This mechanism was previously considered in Refs. 14 and 28 for samples of diamond and polymethyl methacrylate, respectively.
![]()
Figure 7.Photographs of (a) the uncollimated electron beam footprint on borosilicate glass of thickness
![]()
Figure 8.Footprint of a diaphragmed electron beam on a KBr sample in transmitted daylight, together with graphs of the integral absorption coefficient of daylight (in arbitrary units), which characterize the distribution of the density of radiation-induced color centers in the sample in the vertical and horizontal directions passing through the center of the footprint. The distance from the collimating diaphragm to the target was 30 mm, the beam irradiation time was 15 min, and the time from irradiation to the time at which the footprint was taken was 10 min. The angle
During the experiments, a KU-1 fused silica parallelepiped was irradiated using the experimental scheme shown in Fig. 1(c). A webcam was used to photograph the optical emission of the sample in the direction perpendicular to the electron beam axis. A photograph of the optical emission is shown in Fig. 9(a).
Figure 9(b) shows an optical emission photograph of the KU-1 fused silica plate with a thickness of 8 mm located perpendicular to the electron beam axis. The webcam was located behind the plate on the side opposite to the electron injection.
![]()
Figure 9.Photographs of the optical emission of KU-1 samples [the experimental scheme is shown in
The maximum dimensions of the optical emission region in Fig. 9(a) were ∼8 mm in the direction perpendicular to the direction of propagation of the electron beam [this coincides with the dimensions of the optical emission region in Fig. 9(b)] and ∼5 mm along the direction of propagation.
Figure 10 shows the experimental angular distribution of the radiation energy of a KU-1 fused silica plate with a thickness of 8 mm when the plate was positioned perpendicular to the beam axis [see Fig. 1(b)]. It was not possible to carry out such an experiment with a GE012 plate owing to the danger of irradiating the optical fiber with an electron beam passing through the plate. Figure 10 also shows the calculated angular energy distributions of CR for fused silica plates with thicknesses of 8 and 2.18 mm under electron beam irradiation. The difference in angular distribution of radiation energy for plates of different thicknesses is clearly seen. Since relative measurements of the spectral energy density were carried out in the experiment, the positions of the experimental points relative to the calculated dependence normalized per unit was determined by the least squares method. Good agreement is seen between the experimental and calculated data over a wide range of observation angles α. At the qualitative level, the weak dependence of the radiation energy of the “thick” plate on the angle α in the range 0°–50° can be attributed to the strong scattering of the beam electrons in the plate with large thickness and partly to the geometry of the experiment (the fiber-optic waveguide could not be located at a large distance from the sample owing to the low radiation intensity, and therefore the results were influenced by the finite dimensions of the radiation source).
![]()
Figure 10.Radiation energy of a KU-1 fused silica plate with a thickness of 8 mm in the spectral range of 300–800 nm for a collimated electron beam, together with the calculated radiation energy in the same spectral range under similar conditions of electron beam irradiation of fused silica plates with thicknesses of 8 and 2.18 mm for different values of the angle
V. CONCLUSIONS
In this work, we obtained data on the characteristics of CR and PCL in the UV and visible regions when GE012 and KU-1 fused silica plates, as well as KBr plates, located at different angles to the electron beam, were excited by an electron beam with energy 2.7 MeV.
It was found that KBr plates have an intense PCL band with a maximum at 490 nm, in which most of the radiation energy is concentrated. This result may be of interest to specialists studying PCL.
In contrast to KBr, which is strongly luminescent under irradiation by an electron beam, practically all radiation from the fused silica plates was CR for a wide range of plate inclination angles relative to the beam axis. The angular energy distribution of CR depended on the plate thickness. Both experiment and simulation showed that when fused silica plates were arranged perpendicular to the electron beam and their thickness exceeded the path length, the angular energy distribution of CR varied little over a wide range of angles. The results for the optical emission of fused silica plates can be explained by the loss of directivity of the CR and, as a consequence, the amplification of the CR component of the emission of the plates in a wide range of angles of emission from the plates due to scattering of the beam electrons. The results obtained here for the effect of electron beam scattering on the emission spectra of fused silica can be used to develop Cherenkov detectors based on fused silica for recording moderately relativistic electrons (including those in facilities for studying controlled thermonuclear fusion), as well as for other charged particle beam diagnostics.
ACKNOWLEDGMENTS
Acknowledgment. This work was supported by the Ministry of Science and Higher Education of the Russian Federation (Grant Nos. FWRM-2021-0014 and FSWW-2020-0008).
References
[1] J. V.Jelley. Cherenkov Radiation and its Applications(1958).
[2] V. P.Zrelov. Izluchenie Vavilova-Cherenkova I Ego Primenenie V Fizike Vysokikh Energii. Chast I. (Vavilov-Cherenkov Radiation and its Uses in High-Energy Physics. Part I)(1968).
[3] M. J.Eckart, E. P.Hartouni, A. S.Moore, D.Sayre, D. J.Schlossberg et al. A fused silica Cherenkov radiator for high precision time-of-flight measurement of DT γ and neutron spectra (invited). Rev. Sci. Instrum., 89, 10I120(2018).
[4] B. V.Beeman, M. J.Eckart, G. P.Grim, A. S.Moore, D. J.Schlossberg et al.
[5] B.Ratcliff, J.Va’vra. DIRC: Internally reflecting imaging Cherenkov detectors. Nucl. Instrum. Methods Phys. Res., Sect. A, 970, 163442(2020).
[6] L.Bartnik, M.Bergamaschi, M.Billing, V. V.Bleko, R.Kieffer et al. Direct observation of incoherent Cherenkov diffraction radiation in the visible range. Phys. Rev. Lett., 121, 054802(2018).
[7] J.Cohen-Tanugi, M.Convery, B.Ratcliff, X.Sarazin, J.Schwiening et al. Optical properties of the DIRC fused silica Cherenkov radiator. Nucl. Instrum. Methods Phys. Res., Sect. A, 515, 680-700(2003).
[8] M. G.Albrow, H.Kim, S.Los, M.Mazzillo, E.Ramberg et al. Quartz Cherenkov counters for fast timing: QUARTIC. J. Instrum., 7, P10027(2012).
[9] A.Brandt, T.Hoffman, L.Nozka, M.Rijssenbeek, T.Sykora et al. Design of Cherenkov bars for the optical part of the time-of-flight detector in Geant4. Opt. Express, 22, 28984-28996(2014).
[10] D.Breton, L.Burmistrov, G.Cavoto, V.Chaumat, J.Collin et al. Test of full size Cherenkov detector for proton Flux Measurements. Nucl. Instrum. Methods Phys. Res., Sect. A, 787, 173-175(2015).
[11] M.Babzien, K.Kusche, T.Watanabe, V.Yakimenko. Beam angle measurement using Cherenkov radiation, 3742-3744(2005).
[12] M. J.Sadowski. Generation and diagnostics of fast electrons within tokamak plasma. Nukleonika, 56, 85-98(2011).
[13] S.Brezinsek, J. W.Coenen, A.Huber, A.Kirschner, A.Kreter, M.Rubel et al. Overview of wall probes for erosion and deposition studies in the TEXTOR tokamak. Matter Radiat. Extremes, 2, 87-104(2017).
[14] E. Kh.Baksht, D. V.Beloplotov, A. G.Burachenko, D. A.Sorokin, V. F.Tarasenko et al. Luminescence of crystals excited by a runaway electron beam and by excilamp radiation with a peak wavelength of 222 nm. J. Appl. Phys., 122, 154902(2017).
[15] D. V.Beloplotov, M. V.Erofeev, E. I.Lipatov, V. I.Oleshko, V. F.Tarasenko et al. Emission of diamonds, leucosapphire, and KU-1 quartz in the range of 200–800 nm excited by electron beams with a pulse duration of 0.5 and 12 ns. J. Appl. Phys., 125, 244501(2019).
[16] E. Kh.Baksht, D. V.Beloplotov, A. G.Burachenko, M. I.Lomaev, V. F.Tarasenko et al. Spectral and amplitude-time characteristics of crystals excited by a runaway electron beam. Matter Radiat. Extremes, 4, 037401(2019).
[17] E. Kh.Baksht, D. V.Beloplotov, A. G.Burachenko, M. V.Erofeev, V. F.Tarasenko et al. On the influence of electron energy on characteristics of the Cherenkov radiation and cathodoluminescence. Russ. Phys. J., 62, 1181-1190(2019).
[18] E. Kh.Baksht, D. V.Beloplotov, A. G.Burachenko, M. I.Lomaev, V. F.Tarasenko. Cherenkov radiation and cathodoluminescence in sapphire, quartz, and diamond under the excitation of an electron beam. Jpn. J. Appl. Phys., Part 1, 59, SHHD01(2020).
[19] E. Kh.Baksht, M. V.Erofeev, G. A.Naumenko, A. P.Potylitsyn, A. V.Vukolov et al. Cherenkov radiation in the visible and ultraviolet spectral ranges from 6-MeV electrons passing through a quartz plate. JETP Lett., 109, 564-568(2019).
[20] A. I.Novokshonov, A. P.Potylitsyn, S. R.Uglov, A. V.Vukolov. Diagnostics of electron beam based on Cherenkov radiation in an optical fiber. Russ. Phys. J., 59, 1681-1685(2016).
[22]
[23]
[25] J.Ru?i?ka, V. P.Zrelov. Analysis of Tamm’s problem on charge radiation at its uniform motion over a finite trajectory. Czech. J. Phys., 39, 368-383(1989).
[26] J.Ru?i?ka, V. P.Zrelov. Optical transition radiation in a transparent medium and its relation to the Vavilov-Cherenkov radiation. Czech. J. Phys., 43, 551-567(1993).
[27] O.Oiringel, V. N.Tsytovich. Polarization Bremsstrahlung(1994).
[28] E. Kh.Baksht, D. V.Beloplotov, A. G.Burachenko, A. V.Kozyrev, V. F.Tarasenko. Luminescence of polymethyl methacrylate excited by a runaway electron beam and by a KrCl excilamp. IEEE Trans. Plasma Sci., 45, 76-84(2017).


Set citation alerts for the article
Please enter your email address

© Copyright 2018-2021 | Chinese Laser Press. All Rights Reserved 沪ICP备15018463号-20