• Laser & Optoelectronics Progress
  • Vol. 55, Issue 1, 13005 (2018)
Wu Yiqing1、2、3, Sun Tong1、*, Liu Jin1、2、3, Gan Lanping1、2、3, and Liu Muhua1、2、3
Author Affiliations
  • 1School of Engineering, Jiangxi Agricultural University, Nanchang, Jiangxi 330045, China
  • 2Key Laboratory of Optics Electronics Technology and Application of Biomaterials of Jiangxi Province Higher Education, Nanchang, Jiangxi 330045, China
  • 3Collaborative Innovation Center of Postharvest Key Technology and Quality Safety of Fruits and Vegetables in Jiangxi Province, Nanchang, Jiangxi 330045, China
  • show less
    DOI: 10.3788/LOP55.013005 Cite this Article Set citation alerts
    Wu Yiqing, Sun Tong, Liu Jin, Gan Lanping, Liu Muhua. Detection of Chromium Content in Edible Vegetable Oil with DP-LIBS Combined with LSSVM and CARS Methods[J]. Laser & Optoelectronics Progress, 2018, 55(1): 13005 Copy Citation Text show less
    LIBS spectra of samples of 5, 21 and 37
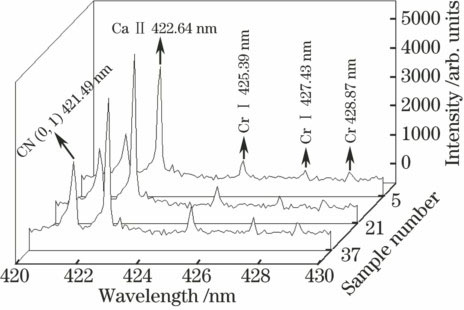
    Fig. 1. LIBS spectra of samples of 5, 21 and 37
    Predicted results of calibration samples with univariate calibration model of Cr I 425.39 nm
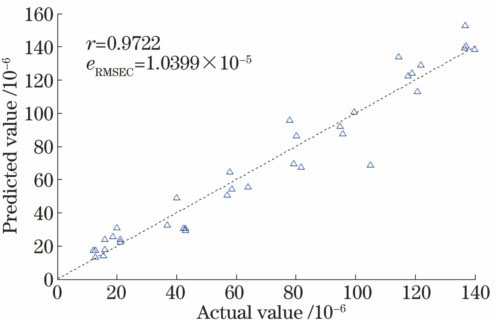
    Fig. 2. Predicted results of calibration samples with univariate calibration model of Cr I 425.39 nm
    Results of CARS variable selection of Cr in vegetable oil. (a) Variation of wavelength variable number; (b) variation of RMSECV; (c) trend of variable regression coefficient
    Fig. 3. Results of CARS variable selection of Cr in vegetable oil. (a) Variation of wavelength variable number; (b) variation of RMSECV; (c) trend of variable regression coefficient
    Distribution of wavelength variables selected by CARS method
    Fig. 4. Distribution of wavelength variables selected by CARS method
    Predicted results of samples in calibration set with CARS-LSSVM calibration model
    Fig. 5. Predicted results of samples in calibration set with CARS-LSSVM calibration model
    Sample numberMass fraction of Cr in soybean oil /10-6
    111.98
    212.85
    318.95 (ps1)
    420.98
    542.95
    642.95
    762.87 (ps5)
    863.92
    980.07
    1081.86 (ps7)
    1199.45
    12104.89
    13117.68 (ps10)
    14121.95
    15136.96
    16139.83
    Table 1. Content of chromium in soybean oil samples
    Sample numberMass fraction of Crin corn oil /10-6
    1715.40
    1815.95
    1919.96
    2020.97
    2136.92
    2240.02
    2356.59 (ps4)
    2458.59
    2579.28
    2679.99 (ps6)
    2791.95 (ps8)
    2895.60
    29114.36
    30120.71
    31134.98 (ps11)
    32136.59
    Table 2. Content of chromium in corn oil samples
    Sample numberMass fraction of Crin peanut oil /10-6
    3312.72
    3415.80
    3518.53
    3621.99 (ps2)
    3740.76 (ps3)
    3842.31
    3957.00
    4057.91
    4177.88
    4281.71
    4394.90
    44103.85 (ps9)
    45117.49
    46118.92
    47136.70
    48139.76 (ps12)
    Table 3. Content of chromium in peanut oil samples
    CharacteristiclineFittingequationCorrelationcoefficient
    Cr I 425.39 nmy=13.82x+167.690.9722
    Cr I 427.43 nmy=10.43x-38.420.9638
    Cr I 428.87 nmy=7.24x-59.360.9440
    Table 4. Fitting results of characteristic spectral line of chromium
    SamplenumberActual massfraction /10-6Predicted massfraction /10-6Relativeerror /%
    ps118.9526.5039.86
    ps221.9937.4370.17
    ps340.7650.8824.82
    ps456.5955.591.77
    ps562.8755.4011.87
    ps679.9973.258.43
    ps781.8668.9115.82
    ps891.9585.556.96
    ps9103.85105.091.19
    ps10117.68116.660.86
    ps11134.98154.2914.31
    ps12139.76141.991.60
    Table 5. Predicted results of prediction samples with univariate calibration model of Cr I 425.39 nm
    SamplenumberActual massfraction /10-6CARS-LSSVMFive-variable LSSVMFull LSSVM
    Predicted massfraction /10-6Relativeerror /%Predicted massfraction /10-6Relativeerror /%Predicted massfraction /10-6Relativeerror /%
    ps118.9522.4618.5227.8545.5342.89126.32
    ps221.9928.2528.4531.0641.2440.5084.13
    ps340.7646.1813.3052.0427.6539.772.44
    ps456.5951.229.4951.698.6642.6424.66
    ps562.8761.751.7761.462.2460.693.47
    ps679.9979.590.5077.892.6275.116.10
    ps781.8680.661.4784.663.4278.883.64
    ps891.9598.977.6399.708.43129.9941.37
    ps9103.85109.295.24111.677.53109.115.07
    ps10117.68126.617.59127.118.01125.796.89
    ps11134.98134.290.51134.170.60131.792.36
    ps12139.76128.378.15134.773.5774.0747.00
    Table 6. Predicted results of samples in prediction set with LSSVM calibration model
    Wu Yiqing, Sun Tong, Liu Jin, Gan Lanping, Liu Muhua. Detection of Chromium Content in Edible Vegetable Oil with DP-LIBS Combined with LSSVM and CARS Methods[J]. Laser & Optoelectronics Progress, 2018, 55(1): 13005
    Download Citation