
Xu Xiaohan, Xia Guo, Jing Shiqun, Wu Su, Wang Guodong. Design of Imaging Detection System for Fluorescent Immune-Chromatographic Test Strip[J]. Chinese Journal of Lasers, 2018, 45(4): 407005
- Chinese Journal of Lasers
- Vol. 45, Issue 4, 407005 (2018)
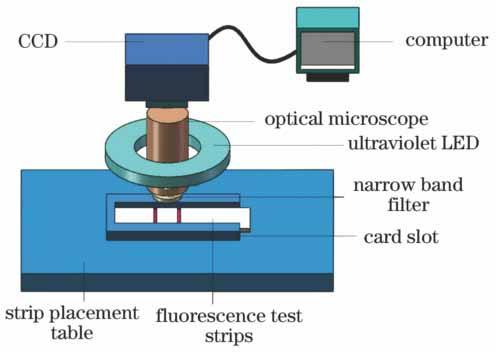
Fig. 1. Acquisition system of fluorescent immune-chromatographic detector
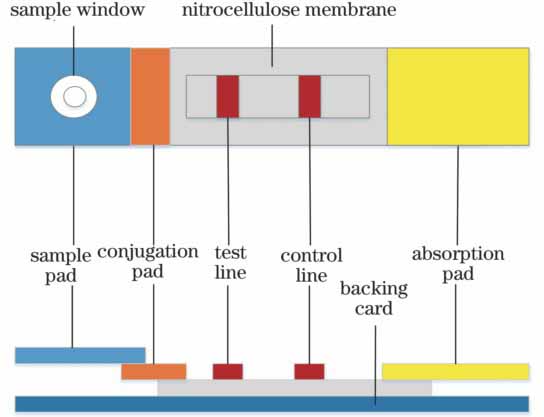
Fig. 2. Structural diagram of fluorescent immune-chromatographic test strip
Fig. 3. Working principle of fluorescent immune-chromatographic detector
Fig. 4. Segmentation result of fluorescent immune-chromatographic test strip. (a) Original image of fluorescent test strip; (b) binary image after segmentation
Fig. 5. Image of fluorescent immune-chromatographic test strip with noise
Fig. 6. Effect images of fluorescent area positioning.(a) Before positioning by algorithm; (b) after positioning by algorithm
Fig. 7. Picture and testing result of ESEQuant fluorescence analyzer. (a) Picture; (b) testing result
Fig. 8. Number of per column target points in binary image after segmentation
Fig. 9. Differences between calculated results using different extended parameters and ESEQuant results
Fig. 10. Standard fitting curves of concentrations
|
Table 1. Evaluation results of segmentation performance
|
Table 2. Eigenvalues of test strip with different concentrations tested by ESEQuant and our instrument
| ||||||||||||||||||||
Table 3. Fitting results of concentration standard curves
| |||||||||||||||||||||||||||||||||||||||||||||||||||||||||||||||||||||||||||||||||||||||||
Table 4. Repetitive test results of eigenvalues of test strip with different concentrations

Set citation alerts for the article
Please enter your email address
© Copyright 2018-2021 | Chinese Laser Press. All Rights Reserved 沪ICP备15018463号-20