• Photonics Research
  • Vol. 9, Issue 12, 2388 (2021)
Feng Zhao1、2, Zicheng Shen2, Decheng Wang1, Bijie Xu1, Xiangning Chen1、3、*, and Yuanmu Yang2、4、*
Author Affiliations
  • 1School of Space Information, Space Engineering University, Beijing 101416, China
  • 2State Key Laboratory of Precision Measurement Technology and Instruments, Department of Precision Instrument, Tsinghua University, Beijing 100084, China
  • 3e-mail: xn_chen_edu@163.com
  • 4e-mail: ymyang@tsinghua.edu.cn
  • show less
    DOI: 10.1364/PRJ.440185 Cite this Article Set citation alerts
    Feng Zhao, Zicheng Shen, Decheng Wang, Bijie Xu, Xiangning Chen, Yuanmu Yang. Synthetic aperture metalens[J]. Photonics Research, 2021, 9(12): 2388 Copy Citation Text show less
    Imaging principle of a synthetic aperture metalens. (a) Schematic of imaging using a conventional subaperture metalens. The image is obtained through the convolution of the target and the PSF of the metalens. (b) Schematic of imaging using a conventional circumcircle aperture metalens. The image is obtained through the convolution of the target and the PSF of the metalens. (c) Comparison of the MTF of the subaperture metalens (blue dashed line), the circumcircle aperture metalens (orange dashed line), and the synthetic aperture metalens (red solid line); (d) schematic of imaging using a synthetic aperture metalens. The image is first obtained through the convolution of the target and the PSF of the metalens, and then recovered using the Richardson–Lucy deconvolution algorithm. The diameter of the subaperture and the circumcircle aperture is set to 2 and 4.8 mm, respectively.
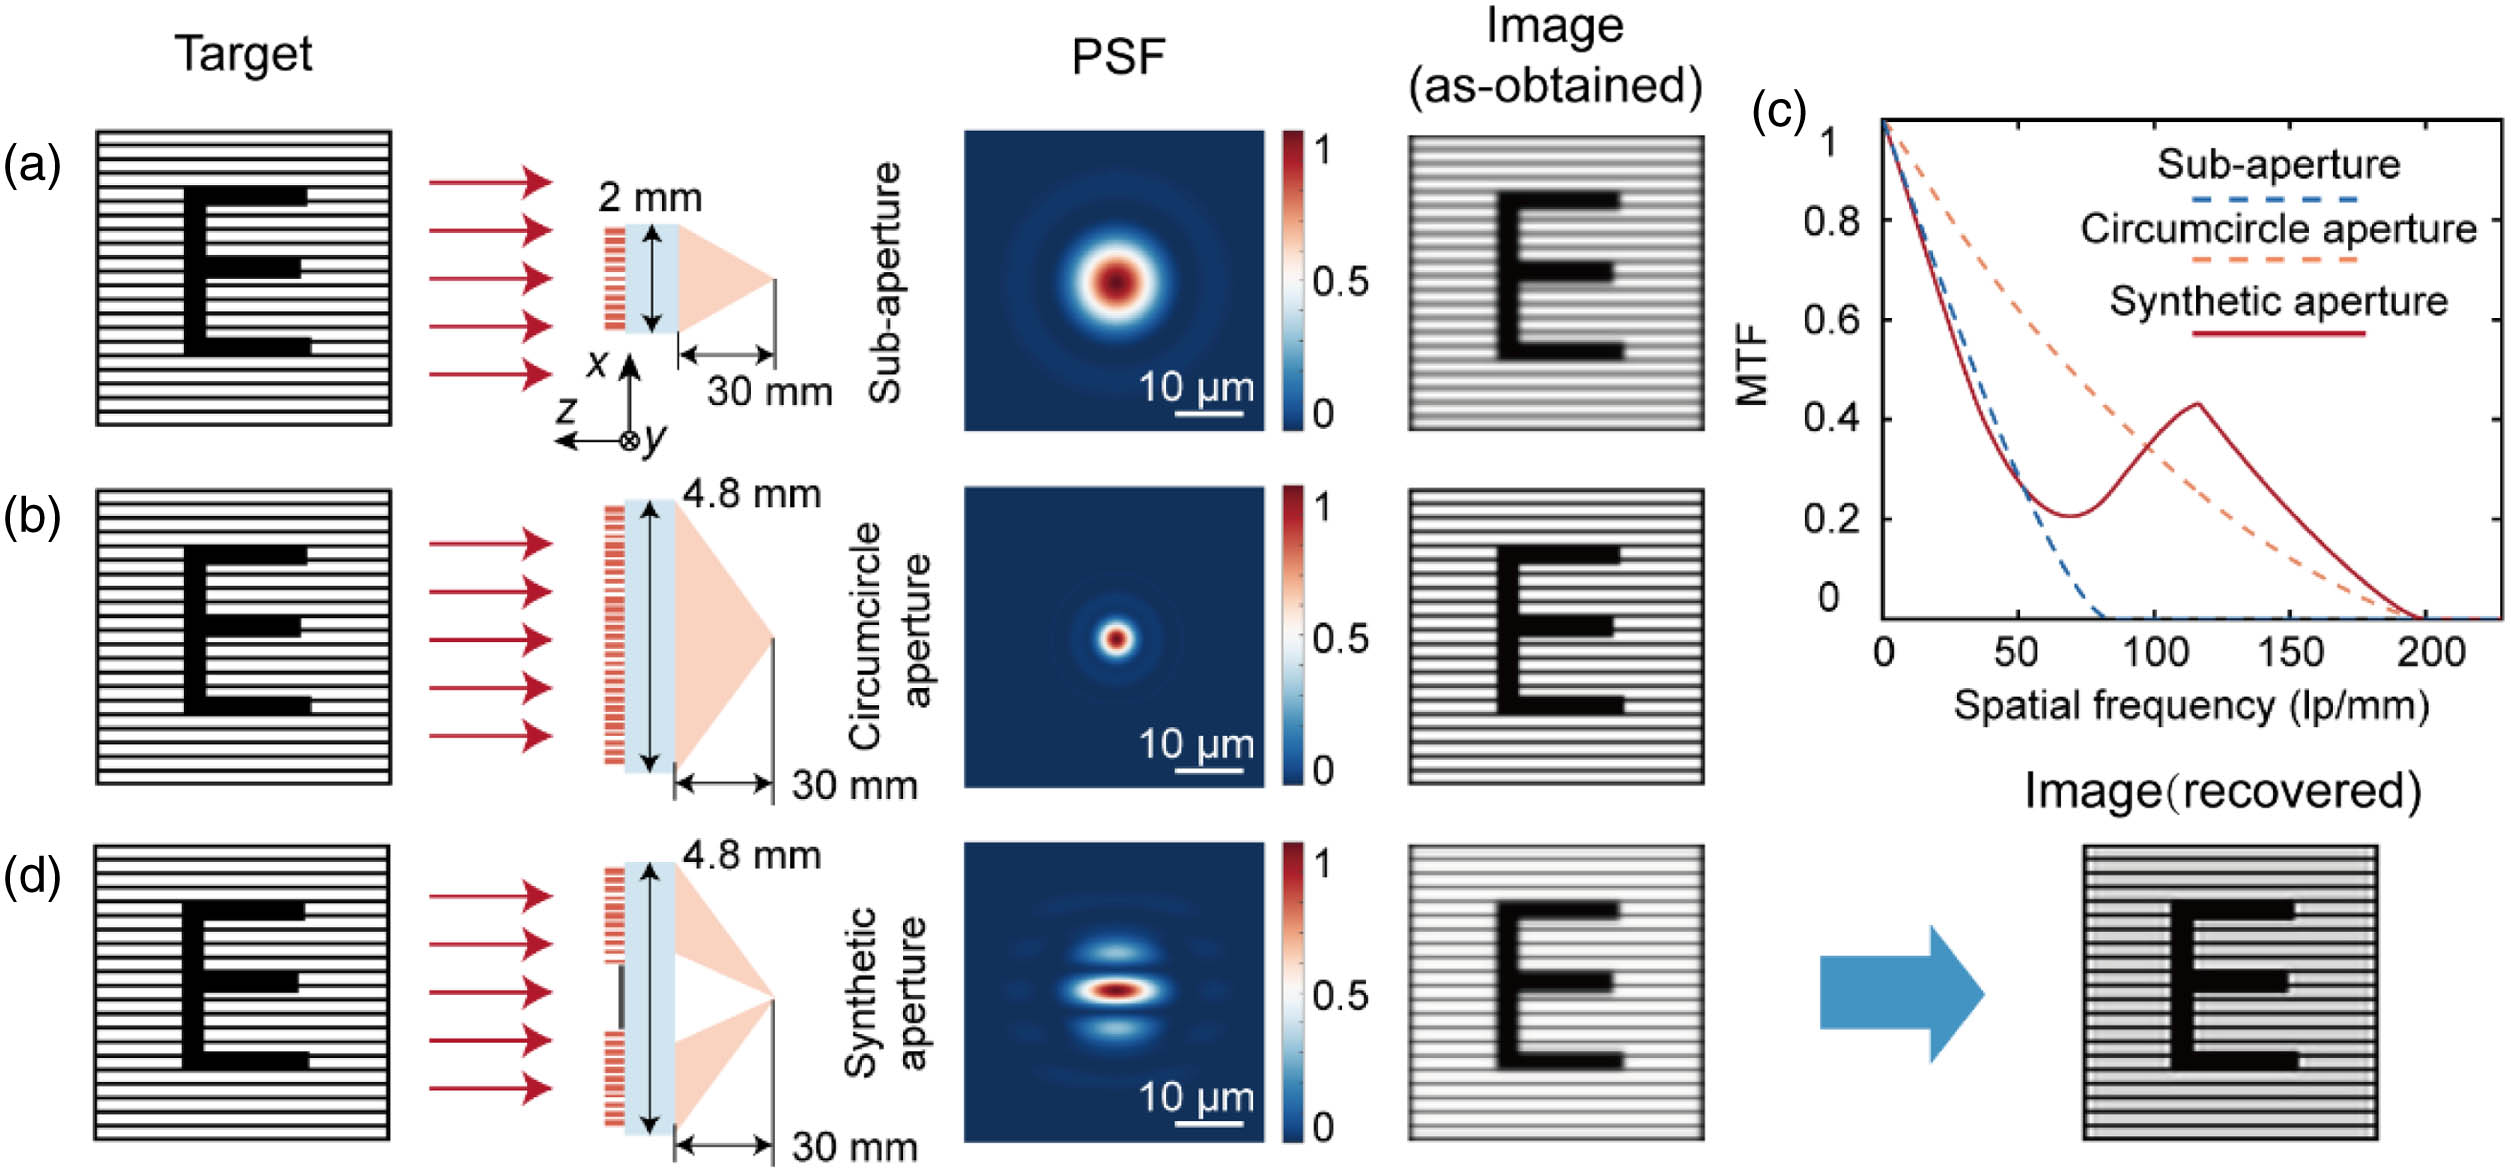
    Fig. 1. Imaging principle of a synthetic aperture metalens. (a) Schematic of imaging using a conventional subaperture metalens. The image is obtained through the convolution of the target and the PSF of the metalens. (b) Schematic of imaging using a conventional circumcircle aperture metalens. The image is obtained through the convolution of the target and the PSF of the metalens. (c) Comparison of the MTF of the subaperture metalens (blue dashed line), the circumcircle aperture metalens (orange dashed line), and the synthetic aperture metalens (red solid line); (d) schematic of imaging using a synthetic aperture metalens. The image is first obtained through the convolution of the target and the PSF of the metalens, and then recovered using the Richardson–Lucy deconvolution algorithm. The diameter of the subaperture and the circumcircle aperture is set to 2 and 4.8 mm, respectively.
    Arrangement and imaging characteristics of ideal synthetic aperture metalenses. (a)–(c) Schematic of the arrangement of synthetic aperture metalenses with two, three, and four subapertures, respectively. The white dashed line marks the circumcircle of the synthetic aperture. (d)–(f) Calculated MTFs of ideal synthetic aperture metalenses with two, three, and four subapertures, respectively; (g)–(i) MTFs of ideal synthetic aperture metalenses with two, three, and four subapertures, marked by the white dashed line in panels (d)–(f), respectively.
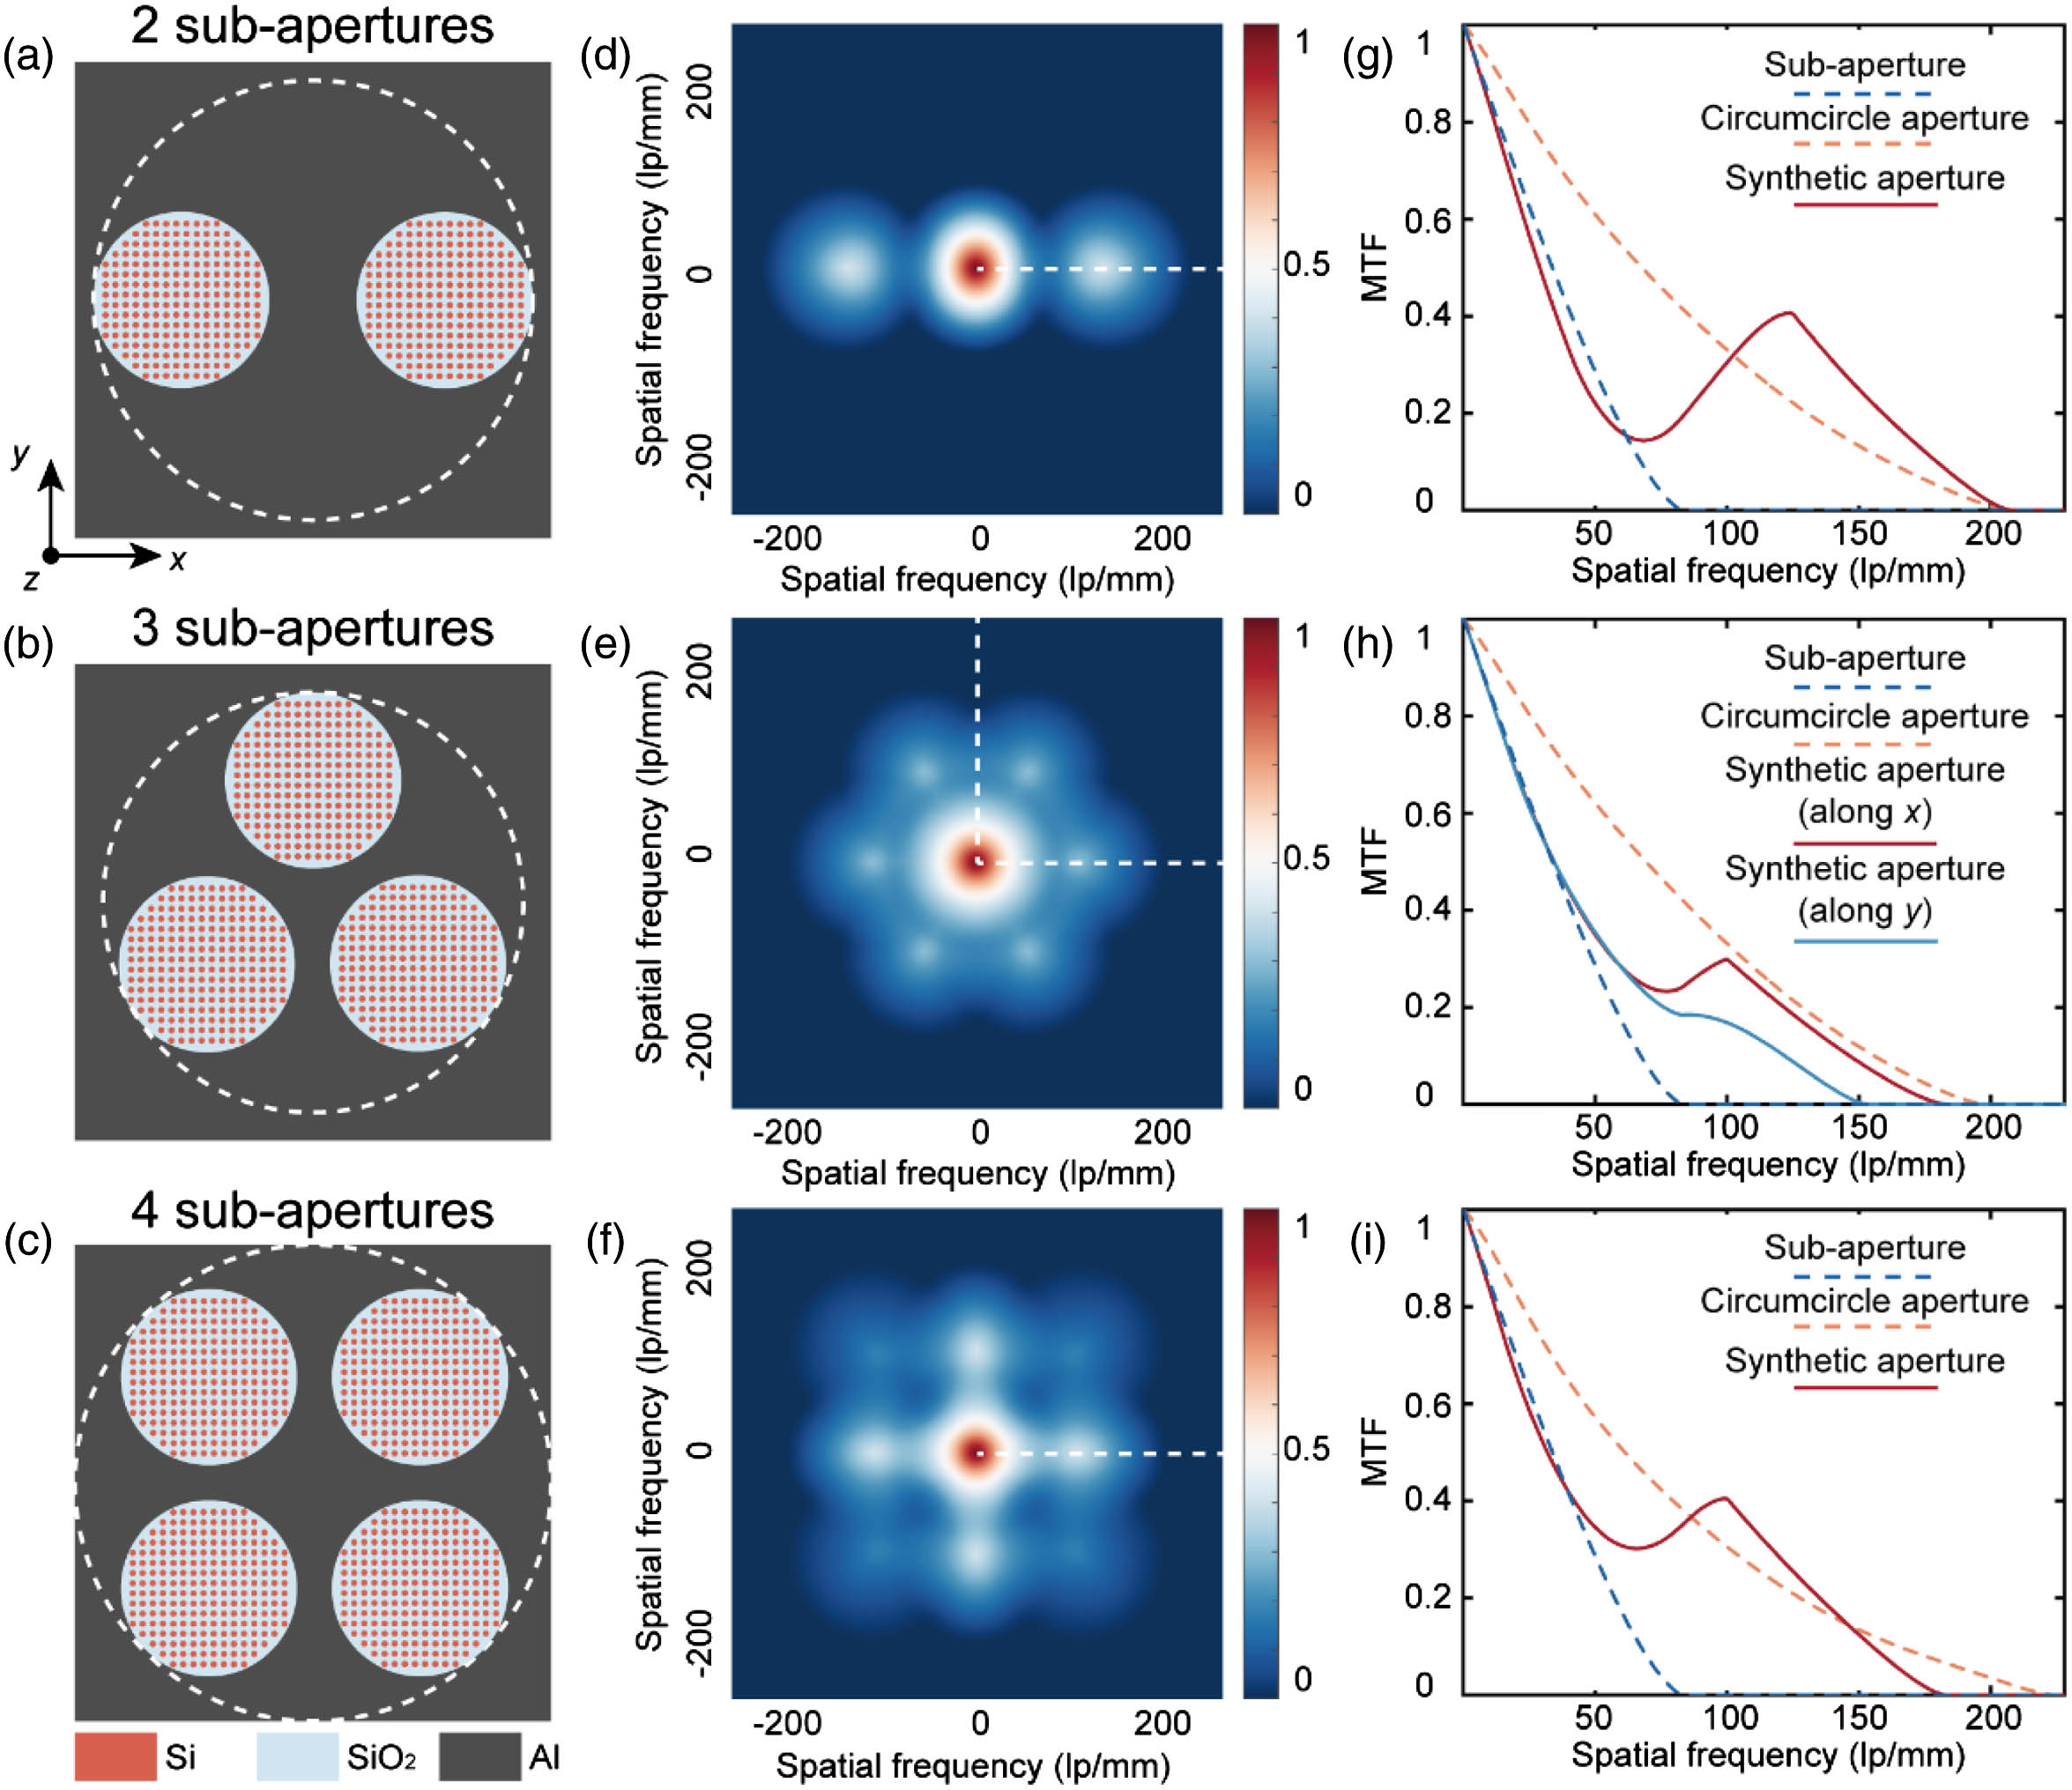
    Fig. 2. Arrangement and imaging characteristics of ideal synthetic aperture metalenses. (a)–(c) Schematic of the arrangement of synthetic aperture metalenses with two, three, and four subapertures, respectively. The white dashed line marks the circumcircle of the synthetic aperture. (d)–(f) Calculated MTFs of ideal synthetic aperture metalenses with two, three, and four subapertures, respectively; (g)–(i) MTFs of ideal synthetic aperture metalenses with two, three, and four subapertures, marked by the white dashed line in panels (d)–(f), respectively.
    Design, fabrication, and characterization of the PSF of synthetic aperture metalenses. (a) Schematic of a unit cell of the metalens, consisting of a-Si nanopillars on a glass substrate; (b), (c) top and side views of the Si nanopillar with height H and radius R, located inside a square unit cell with period U; (d) simulated phase and transmittance of the metalens unit cell as a function of the nanopillar radius; (e) photographs of the fabricated synthetic aperture metalenses with two, three, and four subapertures, respectively; (f) representative top view SEM image of the fabricated metalens sample; (g)–(i) calculated PSFs of ideal synthetic aperture metalenses with two, three, and four subapertures, respectively; (j)–(l) measured PSFs of fabricated synthetic aperture metalenses with two, three, and four subapertures, respectively; (m)–(o) comparison of the calculated and measured PSFs of synthetic aperture metalenses with two, three, and four subapertures, respectively, along the direction specified by the white dashed line in panels (g)–(l).
    Fig. 3. Design, fabrication, and characterization of the PSF of synthetic aperture metalenses. (a) Schematic of a unit cell of the metalens, consisting of a-Si nanopillars on a glass substrate; (b), (c) top and side views of the Si nanopillar with height H and radius R, located inside a square unit cell with period U; (d) simulated phase and transmittance of the metalens unit cell as a function of the nanopillar radius; (e) photographs of the fabricated synthetic aperture metalenses with two, three, and four subapertures, respectively; (f) representative top view SEM image of the fabricated metalens sample; (g)–(i) calculated PSFs of ideal synthetic aperture metalenses with two, three, and four subapertures, respectively; (j)–(l) measured PSFs of fabricated synthetic aperture metalenses with two, three, and four subapertures, respectively; (m)–(o) comparison of the calculated and measured PSFs of synthetic aperture metalenses with two, three, and four subapertures, respectively, along the direction specified by the white dashed line in panels (g)–(l).
    Characterization of the imaging resolution of synthetic aperture metalenses. (a)–(c) Images of the 1951 United States Air Force (USAF) resolution test chart taken with conventional lenses with an aperture radius of 1, 2.38, and 2.7 mm, respectively; (d)–(f) images of the 1951 USAF resolution test chart directly obtained by synthetic aperture metalenses with two, three, and four subapertures, respectively; (g)–(i) images recovered from the ones directly obtained from synthetic aperture metalenses with the Richardson–Lucy deconvolution algorithm.
    Fig. 4. Characterization of the imaging resolution of synthetic aperture metalenses. (a)–(c) Images of the 1951 United States Air Force (USAF) resolution test chart taken with conventional lenses with an aperture radius of 1, 2.38, and 2.7 mm, respectively; (d)–(f) images of the 1951 USAF resolution test chart directly obtained by synthetic aperture metalenses with two, three, and four subapertures, respectively; (g)–(i) images recovered from the ones directly obtained from synthetic aperture metalenses with the Richardson–Lucy deconvolution algorithm.
    Outdoor imaging experiment with the metalens-integrated camera. (a) Photograph of the synthetic aperture metalens-integrated near-infrared camera (CCD, charge-coupled device); (b), (c) images directly obtained by conventional lenses with an aperture radius of 1 and 2.38 mm, respectively; (d), (e) images directly obtained by the synthetic aperture metalens with three subapertures; (f) image recovered from the one directly obtained from the synthetic aperture metalens using the Richardson–Lucy deconvolution algorithm.
    Fig. 5. Outdoor imaging experiment with the metalens-integrated camera. (a) Photograph of the synthetic aperture metalens-integrated near-infrared camera (CCD, charge-coupled device); (b), (c) images directly obtained by conventional lenses with an aperture radius of 1 and 2.38 mm, respectively; (d), (e) images directly obtained by the synthetic aperture metalens with three subapertures; (f) image recovered from the one directly obtained from the synthetic aperture metalens using the Richardson–Lucy deconvolution algorithm.
    Schematic of the fabrication process of the synthetic aperture metalens.
    Fig. 6. Schematic of the fabrication process of the synthetic aperture metalens.
    Schematic of the image restoration process consisting of histogram stretching, Richardson–Lucy deconvolution, and median filtering.
    Fig. 7. Schematic of the image restoration process consisting of histogram stretching, Richardson–Lucy deconvolution, and median filtering.
    Design of a nine-subaperture metalens. (a) Schematic of the arrangement of synthetic aperture metalens with nine subapertures. The white dashed line marks the circumcircle of the synthetic aperture. (b) Calculated PSF of the nine-subaperture synthetic aperture metalens; (c) calculated MTF of the nine-subaperture synthetic aperture metalens with comparison to the subaperture and circumcircle aperture cases.
    Fig. 8. Design of a nine-subaperture metalens. (a) Schematic of the arrangement of synthetic aperture metalens with nine subapertures. The white dashed line marks the circumcircle of the synthetic aperture. (b) Calculated PSF of the nine-subaperture synthetic aperture metalens; (c) calculated MTF of the nine-subaperture synthetic aperture metalens with comparison to the subaperture and circumcircle aperture cases.
    Feng Zhao, Zicheng Shen, Decheng Wang, Bijie Xu, Xiangning Chen, Yuanmu Yang. Synthetic aperture metalens[J]. Photonics Research, 2021, 9(12): 2388
    Download Citation